
goatai.io/glof · Case Study 02
Nepal 2026 — Bhote Koshi / Trishuli Ice-Rock Slope-Failure Cascade
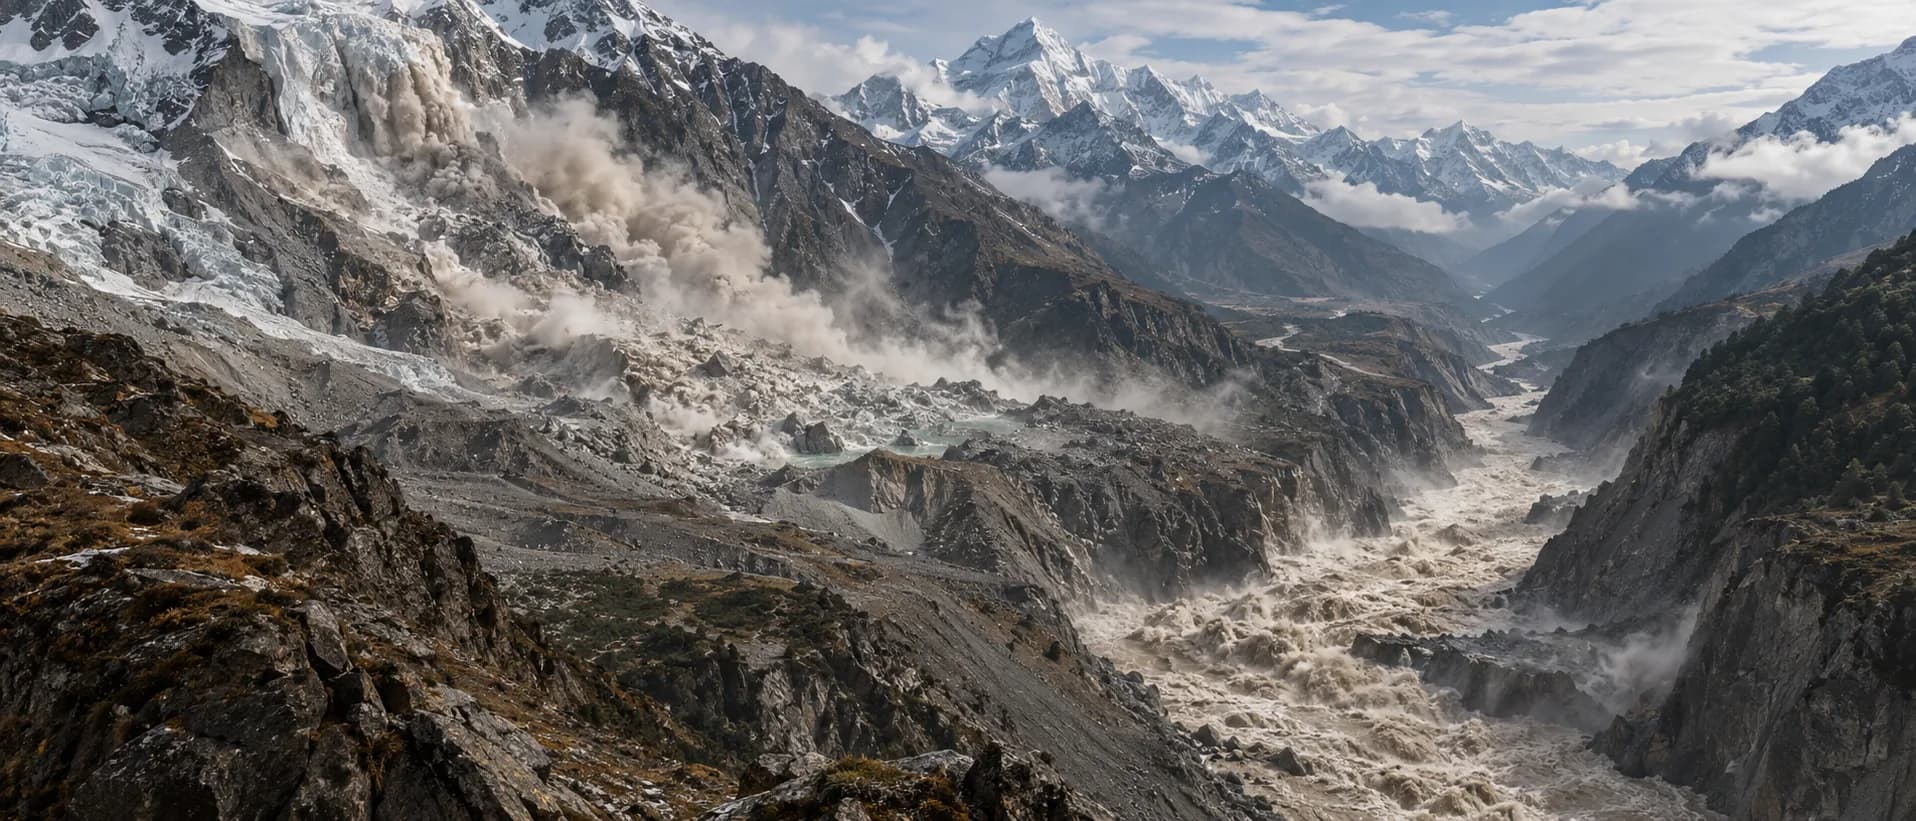
A rapid slope failure involving glacierised terrain, then a debris-rich flash flood down the Bhote Koshi–Trishuli corridor. The hydraulic pathway is unresolved: the evidence so far supports rapid direct channel entry, and transient or sustained obstruction cannot be excluded. This case study does not force one mechanism from incomplete evidence — it keeps observations, competing hypotheses and numerical experiments apart, and updates them as evidence arrives. Same Himalayan cascade class as Sikkim, a different trigger pathway.
Preliminary — hypothesis-testing reconstruction in progress
Evidence as of: 2026-09-11
Classification: rapid ice-rock slope failure, debris avalanche and flash flood — hydraulic mechanism provisional. A sustained landslide-dam breach is one mechanism hypothesis; rapid direct channel entry and a minutes-scale transient obstruction remain alternatives, and a pre-existing glacial lake failure is not confirmed. Every external value is dated, tiered and tied to an evidence-register entry; every model value is tied to a named simulation output. Uncalibrated: no parameter was fitted to any gauge observation. What changed since 4 September · Changelog
Ensemble Members
4 members
3 sustained-blockage scenarios: 0.6–6.0 Mm³ impounded water · 1 continuous-propagation scenario: 5.0 Mm³ assumed hydraulically mobilised volume
Monitoring Gap
What the corridor could not see
Four facts about this corridor on 26 August, each tied to an evidence-register entry. They are the reason the monitoring argument is about corridors rather than lakes.
A lake inventory would not have flagged the source
China’s Ministry of Water Resources reports no moraine lake larger than 0.1 km² on the Nepal side above Gyirong Port, and no pre-existing glacial lake failure has been confirmed. [E-066]
The unit of risk is the corridor and its evolving source zones, not a named lake.
Method
What is transferable here is the procedure, not this event
The reconstruction below runs a fixed procedure: an evidence register in which every datum carries tier, confidence and permitted use; a tiered epistemic state separating what is established from what is unresolved; an end-member ensemble spanning the mechanism branches rather than a single preferred scenario; per-member consistency checks against observations the model was not built to match; a published missing-data register; and a dated changelog that keeps superseded interpretations visible. The same procedure applies to any asset corridor, and it produces those six artefacts each time. Everything on this page is screening-level and preliminary.
Update · 11 September 2026
What changed since 4 September
Newly published evidence, evidence that existed but had been missed, and corrections to our own interpretation — kept apart, because they bear on credibility differently.
Newly published evidence
- USGS reclassified both seismic signals as landslide-type and revised its trigger wording on 28 August from “glacial collapse” to “rapid slope failure involving a glacier”. [E-002 · E-004 · E-005 · E-006]
- UNOSAT mapped two newly formed barrier lakes (≈12 ha and ≈19.5 ha) on 28 August imagery; Chinese authorities reported the lower lake drained by 30 August–1 September. [E-054 · E-055 · E-058 · E-059]
- NDRRMA’s first situation report (1 September) places the temporary lakes after the avalanche and debris flood. [E-015]
- Source-volume estimates from identifiable scientists now exist — none peer-reviewed, spanning 25 to ~490 Mm³ of bulk material. [E-070 · E-071 · E-072 · E-073]
Available before, recovered on 11 September
- DHM 10-minute gauge telemetry: Galchhi began rising between 10:20 and 10:30 NPT, Malekhu between 11:10 and 11:20. Arrival timing — carried as not-evaluable on 4 September — is now observed. [E-020 · E-021 · E-025]
- The “~1.4 Mm³ reported impoundment” is China’s Ministry of Water Resources estimate for a pond in the avalanche impact crater, measured on 30 August. It is a post-event store, not the reservoir of the 26 August wave. [E-050 · E-051 · E-052]
- Two blockage locations were given by the same DHM official on 26 August — about 20 km and about 10 km above the Miteri Bridge. [E-040 · E-041]
- A rapid analysis (IRDR, via ADRC) describes a dam formed on 25 August and breached at 08:30–08:37. It conflicts with the USGS and Chinese timing accounts; its source report could not be retrieved. [E-018 · E-019 · E-016]
- The July 2025 flood on the same corridor — a supraglacial lake outburst on the Purepu Glacier — is now documented here. [E-090 · E-091]
Corrections to interpretation
- “+30 min — Trishuli gauges respond” was wrong: ICIMOD’s 30 minutes is how long the rise lasted at each gauge, not a travel time. [E-023 · E-022]
- The headline argument — the gauges needed far more water than the reported impoundment — compared the flood with a lake that formed afterwards. It has been withdrawn and replaced, not defended. [E-050]
- All four members miss the observed arrival timing by more than their tolerance. The miss is common to every member, including the one released at T0, so the observed timing rejects the shared routing configuration as presently parameterised — it does not pick a mechanism. [E-002 · E-020 · E-021]
- A stage-metric defect was found: part of every published stage rise is a baseline switch, not flood wave. The “direct member overshoots” statement does not survive the correction.
Does the main conclusion change? The mechanism remains unresolved. What changed is why: the timing observation the 4 September page was waiting for now exists, and this model cannot use it to separate the mechanisms until its routing is constrained independently. Full changelog ↓
Epistemic State
What the evidence currently supports
Three tiers, so the state of knowledge is readable in seconds. Confidence refers to the evidence for the statement, not to the model.
High confidence
- a major rapid slope failure involving glacierised terrain, 08:37:10 NPT [E-002 · E-005]
- a debris avalanche / mass movement, classified landslide-type by USGS [E-003 · E-009]
- rapid downstream flood propagation through the corridor [E-020 · E-021]
- substantial debris and sediment involvement [E-009 · E-077]
- major stage rise at the downstream gauges [E-022 · E-023]
- barrier lakes formed after the flood [E-015 · E-054 · E-055]
Unresolved
- whether a hydraulically significant pre-event impoundment formed [E-019 · E-065]
- the duration of any temporary obstruction [E-078]
- total source mass [E-070 · E-073 · E-074]
- the hydraulically effective water and sediment volume
- the release hydrograph
- how far each reach behaved as a debris flow rather than a flood wave
Measurability
Why this event was hard to measure
Every quantity on this page descends from the two gauges that survived out of five. That is worth stating plainly, because it bounds what any reconstruction of this event can claim.
Before — susceptibility, not prediction
No usable short-term precursor exists for a brittle ice-rock detachment: the failure is the start of the event. Over longer horizons InSAR and offset tracking can detect progressive deformation, but C-band decorrelates over snow and ice, revisit is 6–12 days against a process that can run in hours, and the base rate is unfavourable — many slopes creep, very few fail.
The honest product of this phase is siting and susceptibility: which reaches deserve instruments, which source zones a lake inventory misses. This corridor was identifiable as high-priority in advance — the 2015 avalanche came off the same mountain [E-100] and the 2025 flood came down the same corridor from a different glacier [E-078 · E-090]. Nothing would have given the date.
During — not Earth observation
Revisit in days, latency in hours, and near-permanent monsoon cloud: across the whole post-event window to 13 September, no Sentinel-2 scene over this corridor came in below 40% cloud[E-046].
This phase belongs to seismic and infrasound at the source, to in-corridor sensing that either survives or fails informatively, and to the telemetry-loss logic above. Seismic also does not respect the border: the source lay across it and the signal was recorded and timestamped regardless [E-002 · E-010].
After — where measurement is possible
The only phase that can be instrumented retrospectively, because the archive already holds both 8 July 2025 and 26 August 2026. Corridor state, geomorphic change, exposure — and the calibration that would make any timing claim trustworthy.
The 2025 analogue is already measurable: its post-event window cleared to 1% cloud by late September, while the 2026 window has not yet reached that point[E-046]. That asymmetry is the organising fact of this section — Earth observation carries the before and after phases, and carries nothing during.
Event Reconstruction
What happened on 26 August 2026
Event origin, reported onset, gauge rise onset and rise duration are different quantities and are labelled as such. Conflicting accounts are recorded side by side, not reconciled. A working timeline, not a validated model output.
25 Aug
Contested account
Dam formed the previous afternoon? (IRDR via ADRC)
A rapid analysis describes an ice-rock failure at 13:00–14:00 NPT on 25 August damming the river for 18–19 hours. The underlying report could not be retrieved, and the account conflicts with the USGS and Chinese timings below. Recorded, not adopted. [E-019]
08:37:10
Event origin
Landslide-type seismic signal, M5.2
USGS ComCat origin time, event type “landslide”, reviewed — first reported as an M4.4 earthquake and reclassified. NDRRMA describes the signal as generated by the mass movement itself. DHM separately relays a local M2.6 signal at 08:20 (single source, no attribution); ICIMOD reports anomalous signals at the Jilong and Zhangmu seismometers, with no causal link established. The ADRC chronology places a dam breach at 08:30–08:37. [E-002 · E-003 · E-015 · E-012 · E-013 · E-018]
~09:00
Reported flood onset
11:10–11:20
Gauge rise onset
Malekhu begins to rise; station destroyed mid-rise
+7.13 m by the last sample at 11:40, after which the station was lost — so the recorded rise is a lower bound. DHM’s warning and danger crossings are given as 11:20/11:40 in its press release and 11:26/11:43 in its technical report. [E-021 · E-024 · E-029 · E-030]
11:45:35
Second signal
Second landslide-type signal, M4.2
3 h 08 min after the first; location fixed to the first event; what failed is not stated. Distinct from the barrier-lake events of 27–30 August. [E-004]
27 Aug–4 Sep
Post-event secondary hazard
Newly formed barrier lakes
A lower lake near the Chhochen–Purepu confluence was put at ~2 Mm³ of water and overflowing on 27 August, with later estimates of more than 2.5 and up to 4 Mm³; China’s Ministry of Natural Resources put a funnel-shaped water body below the source at more than 120,000 m², depth unknown, on 28 August; UNOSAT mapped two new lakes on 28 August imagery; an overflow on 28 August was followed by a reported 0.6 m river rise (army spokesperson, no gauge location). The lower lake was reported drained by 30 August–1 September. A crater pond below the source was put at 1.4 Mm³ on 30 August and 0.65 Mm³ on 31 August; Nepal’s FFD reported an upper lake refilling on 4 September. None of these is the modelled T+3 h secondary pulse. [E-056 · E-068 · E-069 · E-053 · E-054 · E-055 · E-060 · E-058 · E-059 · E-050 · E-051 · E-062]
NPT is UTC+05:45; Beijing time is NPT+02:15. Human impact figures are still changing and are deliberately not published here. They are also excluded from model calibration — a reconstruction validated against casualty counts is not a physical model.
Warning Lead Time
How much warning existed
Reconstructed from the gauge record and DHM’s own account. T0 is the USGS origin of the slope failure at 08:37:10 NPT, and every offset is arithmetic on it. Lead time is measured from the first warnings issued at 09:15 NPT to the local gauge rise onset.
| Corridor point | Clock (NPT) | Offset from T0 | Lead time after first warning | Evidence |
|---|---|---|---|---|
| Ice-rock slope failure (T0) | 08:37:10 | — | — | [E-002] |
| Rasuwagadhi gauge · last telemetry, no rise recorded | 08:40 | +3 min | no warning yet | [E-026] |
| Gyirong Port / border reached, ~22 km | ~08:44 | ~+7 min | no warning yet | [E-016 · E-017] |
| Syabrubesi gauge · last telemetry, no rise recorded | 08:50 | +13 min | no warning yet | [E-027] |
| Flood Forecasting Division notified | 09:00–09:05 | +23 to +28 min | — | [E-033 · E-037] |
| First DHM warnings issued | 09:15 | +38 min | 0 — the reference point | [E-033 · E-037] |
| Betrawati gauge · last telemetry, no rise recorded | 09:20 | +43 min | no rise recorded | [E-028] |
| Galchhi rise onset | 10:20–10:30 | +1 h 43 m to +1 h 53 m | 65–75 min | [E-020 · E-038] |
| Malekhu rise onset | 11:10–11:20 | +2 h 33 m to +2 h 43 m | 115–125 min | [E-021 · E-038] |
| Devghat rise onset · 168 km, outside the modelled corridor | 14:10–14:20 | +5 h 33 m to +5 h 43 m | about 295–305 min | [E-036 · E-038] |
Above Betrawati: no warning at all
Downstream: lead time existed
Below Galchhi the gap between the first warning and the local rise was over an hour and grew with distance — 65–75 min at Galchhi, 115–125 min at Malekhu, about 5 h at Devghat[E-038]. It is in the record, not produced by any model.
What the detection chain cost
About 23–28 min from failure to institutional awareness and about 38 min to a first warning[E-037], on a corridor whose source is across an international border and where no gauge survived above Betrawati.
Lead time is a property of location, not of technology
Timure and Syabrubesi had effectively none. Galchhi had over an hour and a half from the failure, Devghat most of a working day [E-038]. No improvement in sensing, classification or dissemination changes those numbers, because they are set by the distance between the source and the asset. The corollary is uncomfortable: some assets cannot be protected by a warning system at all, and need structural or operational measures instead.
Do not generalise these figures. They are observed at four real stations on one corridor. Extending them to any other location needs a travel-time model, and this page’s own ensemble misses the observed arrivals by hours — see the routing result. Until that routing is calibrated, lead time cannot be stated for a location without an observed arrival.
These are the lead times this event’s detection chain happened to produce, reconstructed after the fact. They are not a system performance claim and not a forecast of what any warning system would achieve.
The corridor did detect the wave — in the loss of the signal, not in the signal
Three stations stopped transmitting in strict downstream order — Rasuwagadhi 08:40, Syabrubesi 08:50, Betrawati 09:20 — and none of them recorded a rise first[E-026 · E-027 · E-028 · E-039]. The sequence is consistent with the wave passing each site. The second loss, at 08:50, came 25 minutes before the first warning was issued at 09:15; the third came 5 minutes after it. No supervisory logic existed to treat coincident, correctly ordered loss of telemetry as an affirmative input.
The limits matter as much as the finding. A last transmission is an upper bound on the time of loss, resolved only to the 10-minute polling interval. Loss of transmission has causes other than destruction — power, communications, the station itself — so the ordering is consistent with propagation rather than proof of it, though DHM separately states the Rasuwagadhi station was swept away [E-026]. An apparent mean celerity of about 19 m/s over the 45.8 km between the first and last loss follows from these times, but it rests on model chainage rather than surveyed distances and is order-of-magnitude only [E-039]. This is a design finding recovered from the record afterwards — not a method that was available on the day.
The gap was not a sensing gap
The physical signal existed at T+0 and was recorded by existing regional and teleseismic networks, with an origin time resolved to the second [E-002]. The first warning went out at 09:15, about 38 minutes later [E-045], and it went out because people telephoned each other: DHM was notified at 09:00–09:05 by the district administration and by station staff[E-033].
What that does not mean: that a warning could have been issued minutes after the failure. An automatic seismic solution takes minutes rather than seconds; this event was initially catalogued as an M4.4 earthquake[E-012 · E-003] and only later reclassified as landslide-type[E-002]; and the published classification wording was still being revised on 28 August [E-006 · E-005]. The defensible statement is narrower and more useful: the signal was available long before the warning, real-time discrimination of landslide-type signals from earthquakes is the missing capability, and no route existed from a seismic detection into this corridor’s warning chain.
Cascade Class
Same cascade class as Sikkim, different initiating process
South Lhonak failed through a named glacial lake. For Rasuwa, the observed initiating process is a rapid ice-rock slope failure, followed by three possible hydraulic pathways: continuous propagation, a minutes-scale transient obstruction, or sustained blockage and release. The ensemble covers two of them; the transient obstruction is not modelled yet. Both are cryosphere-driven cascades, but only South Lhonak is established as a classical GLOF pathway.
Why the unresolved mechanism does not block operational use
The required downstream response is the same under all three branches. A hydraulic wave of this magnitude arrives at Galchhi and Malekhu whether it came from continuous propagation, a minutes-scale plug or a sustained blockage [E-020 · E-021 · E-022]. So a warning chain has to trigger on source signal and observed corridor propagation, not on a mechanism classification: that classification was not available on 26 August, is still not available now, and is not needed in order to act. The branches below matter for reconstructing the event and for deciding what to monitor at the source — not for deciding whether to warn.
Sikkim 2023 · reconstructed
Moraine-lake outburst archetype
- 01Moraine / ice-rock collapse
- 02Impulse wave into existing proglacial lake
- 03Moraine overtopping and breach
- 04Outburst hydrograph
- 05Downstream river routing
- 06Hydropower cascade failure
Nepal 2026 · Branch A · hypothesis
Continuous propagation
- 01Ice-rock slope failure
- 02Direct channel entry
- 03Entrainment and melt
- 04Debris-rich hydraulic wave
Members: direct — mobilised from T+0
Currently more consistent with the available timing and event-classification evidence, while the hydraulic pathway remains unresolved. USGS describes the debris entraining water and material “in the existing stream and river channels”; one Chinese expert states there was no barrier lake in the original process; the reported runout to the border post is 6–7 minutes. [E-009 · E-065 · E-016]
Nepal 2026 · Branch B · hypothesis · not modelled
Transient plug (minutes)
- 01Ice-rock slope failure
- 02Channel obstruction lasting minutes
- 03Rapid release
- 04Debris-rich hydraulic wave
Members: not represented in the current ensemble
Physically distinct from both A and C, and the gap in the present ensemble. HiRISK reports the mass flow dammed the Lhende Khola “potentially only for a matter of minutes”. Until members with obstruction durations of minutes are run, the ensemble cannot claim to span the mechanism space. [E-078]
Nepal 2026 · Branch C · hypothesis
Sustained blockage
- 01Ice-rock slope failure
- 02Channel blockage
- 03Impoundment
- 04Breach or overflow
Members: low · medium · high — release 0.5–2 h after the failure
Less consistent with the current timing and classification evidence after the refresh. The 6–7 minute runout, the landslide-type classification of the M5.2 signal and NDRRMA’s placement of the lakes after the flood leave little room for a blockage that stored water for hours after 08:37. A variant with the dam formed on 25 August rests on one rapid analysis whose report could not be retrieved. [E-016 · E-002 · E-015 · E-019]
A named lake is not the unit of risk
China’s Ministry of Water Resources reports no moraine lake larger than 0.1 km² on the Nepal side above Gyirong Port [E-066], and no pre-existing glacial lake failure has been confirmed, so the event is not labelled a GLOF. The distinction is operational rather than semantic: monitoring has to include unstable glacierised slopes, transient channel obstruction and downstream cascade propagation alongside persistent glacial lakes. The corridor evidence behind that conclusion is set out near the top of this page.
Screening Simulation
The reconstruction, running
The four-member ensemble represents two modelled end-member branches within a three-branch physical hypothesis space: branch A continuous propagation, branch B a minutes-scale transient obstruction not yet modelled, and branch C sustained blockage. Routed down the real corridor — OpenStreetMap river centerlines, an SRTM long profile, landslide-dam breach hydrographs and debris-bulked Muskingum-Cunge routing to the Trishuli gauges. Preliminary and uncalibrated: the point is where the members disagree, not any one line.
Corridor Modelled
127.9 km
Source reach → Malekhu
Ensemble Members
4 members
End-member experiments · 2 of 3 branches
Peak at Source
0.6k–10.7k m³/s
Water-equivalent; bulked ×1.3–3.0 in routing
Observational Checks
5 evaluable
Timing now evaluable · rapid onset moved to internal
Branch C · sustained blockage
Branch A · continuous propagation
The embedded view plays the ensemble as run on 4 September. The evidence-consistency assessment and interpretation on this page reflect the 11 September evidence and supersede the embedded panels where they differ. No parameter was fitted to a gauge observation, no source volume is claimed, and the hydraulic mechanism stays provisional.
Open Simulation →Results
What the ensemble produces
Two modelled end-member branches within a three-branch physical hypothesis space: the members bracket continuous propagation (branch A) and sustained blockage (branch C), while a minutes-scale transient obstruction (branch B) is not yet modelled. Every value below is model output from sim-claude edff56c · outputs 4 Sep 2026 · diagnostics 11 Sep 2026. All four were specified after the ICIMOD stage reports were public, so none is an independent prediction of stage; none was specified with knowledge of the DHM timing.
| Member | Hypothesis | Source volume (type) | Blockage | Release mode | Bulking | Peak at source · water / bulked | Galchhi arrival | Galchhi stage rise · as run |
|---|---|---|---|---|---|---|---|---|
| low | Sustained blockage | 0.6 Mm³ impounded water (scenario) | 15 m | overtopping erosion | ×1.3 | 634 / 824 m³/s | T+8.2 h | 1.3 m |
| medium | Sustained blockage | 1.4 Mm³ impounded water (scenario) | 25 m | progressive debris release | ×1.8 | 2,364 / 4,255 m³/s | T+6.6 h | 3.5 m |
| high | Sustained blockage | 6 Mm³ impounded water (scenario) | 40 m | rapid dam collapse | ×2.5 | 10,736 / 26,839 m³/s | T+5.1 h | 9.9 m |
| direct | No sustained blockage | 5 Mm³ assumed hydraulically mobilised volume (scenario) | none | no impoundment | ×3 | 9,564 / 28,691 m³/s | T+4.0 h | 13.4 m |
Water peak: water-equivalent discharge (breach release + avalanche surge + baseflow). Bulked peak: water × bulking, the debris-bulked volume flux that is routed. The direct member’s 5 Mm³ is an assumed hydraulically mobilised volume — the scenario label from which its routed 4 Mm³ water-equivalent surge was set. It does not enter the solver, and it is not an estimate of the total failed rock-and-ice mass. Geological source volume, hydraulically mobilised volume and water-equivalent flood volume are three different quantities; reported source-volume estimates of 25 to ~490 Mm³ of bulk material are the first of these [E-070 · E-073]. No member is parameterised from an observed failure volume or an observed store.
The finding worth arguing about
Independent arrival observations reject something all four members share — before they resolve the source mechanism
The 4 September version argued that the reported gauge response needed an order of magnitude more water than the “reported ~1.4 Mm³ impoundment”. That figure describes a pond measured four days after the flood [E-050], so the argument compared the flood with a store that did not exist when it happened. It is withdrawn.
What the miss costs operationally. Every member, including the one released at T0, reaches Galchhi hours after the observed onset[E-020]. What the observation rejects is the routing configuration common to all four. For anyone building a warning system on the same ingredients — OpenStreetMap centrelines, an SRTM-era long profile, conventional Manning values and a bulking proxy — that is a systematic overstatement of the travel time available. A system parameterised that way would promise lead time it cannot deliver, and the error stays invisible until an event tests it. Corridor-specific calibration against a recorded event on the same reach is not a refinement; it is the precondition, in the order set out below.
Independent timing test
The ensemble was configured on 4 September, before the DHM gauge rise-onset timestamps used here were recovered on 11 September. No member was fitted to arrival timing, and the tolerances (±30 min on an arrival, ±20 min on the travel time) were fixed before any timestamp was known. These observations are therefore an independent diagnostic of the routing configuration rather than a test the model was built to pass — which is why the result below is read as previously unused observations exposing a shared structural deficiency, not as a simulation that simply failed. [E-020 · E-021 · E-002]
What the observations show
Galchhi began rising between 10:20 and 10:30 NPT and Malekhu between 11:10 and 11:20 — T+1.7–1.9 h and T+2.5–2.7 h after the USGS origin. Each rise lasted about 30 minutes; the onsets are about 50 minutes apart. [E-020 · E-021 · E-025 · E-002]
Chinese accounts put the impact at Gyirong Port 6–7 minutes after the collapse [E-016 · E-017]. Every lake with a reported volume (0.65–4 Mm³ of water) was observed from 27 August onward, and NDRRMA places the lakes after the flood [E-015 · E-051 · E-056 · E-069]. The only account of an impoundment before the flood could not be traced to its source report [E-019].
Source-volume estimates from identifiable scientists range from 25 to ~490 Mm³ of bulk material, none peer-reviewed [E-073 · E-072 · E-071 · E-070]. They are bulk source volumes, not water volumes, and are not compared numerically with anything on this page.
What the model shows
Timing. Every member misses both arrival checks. The direct member releases at T0 and still reaches Galchhi 2.1 h after the observed onset window. Because the bias is common to both mechanism branches, the observed timing rejects the shared routing configuration as presently parameterised. Which part of that configuration is responsible is not yet isolated: candidates include the channel geometry and assumed hydraulic widths, the SRTM-derived long profile and slopes, Manning resistance, the debris-bulking representation, reach discretisation, source hydrograph shape, flow rheology, the arrival-detection criterion, and transient storage or acceleration the model does not represent.
Stage. As run, only the high member reaches both stage bands, on a 6 Mm³ impoundment, a 40 m dam, rapid collapse and ×2.5 bulking — its water peak is 5.75× the Costa & Schuster estimate. That is assumption-intensive, not invalid. After the baseline defect is removed, the direct member reaches both bands too; low and medium reach neither under any metric.
Order-of-magnitude hydraulic consistency. Inverting Manning normal depth at Galchhi’s +9 m on assumed geometry puts the flow at roughly 2 × 10⁴ m³/s of clear water, or ≈1.2–1.5 × 10⁴ m³/s as a debris-bulked volume flux at ×1.8–2.5, which is ≈4.6–8.3 × 10³ m³/s water-equivalent. Held for a triangular 1–3 h wave, the water-equivalent volume spans roughly 7 to 115 Mm³ across the three roughness cases. The Galchhi stage stayed more than 1 m above its pre-flood level for about 3 hours [E-035], which favours the longer durations. This is a screening check on whether the simulated flood magnitude is physically compatible with the observed stage — not a discharge reconstruction or a gauge rating, and there is no rating curve to check it against.
What the model cannot establish
Which mechanism occurred. After correction, the stage checks accept one member from each family, and the timing checks reject all four for a reason unrelated to mechanism.
Whether a transient plug formed and failed within minutes, as HiRISK suggests [E-078]. The blockage members hold water for 0.5–2 h and the direct member holds none; neither resolves a minutes-long blockage.
Any flood volume. The inversion volumes depend on assumed width, slope, roughness, baseflow and hydrograph shape, and they share the baseline convention of the stage defect. They are not comparable to the post-event lake storages or to the source bulk-volume estimates without a conversion model.
What would discriminate
A flow record at or above Rasuwagadhi for 25–26 August. A dam that held water for 18–19 hours should have cut flow downstream for most of a day. The public DHM endpoint no longer holds those days; Chinese-side records and 25 August imagery would serve too.[E-019 · E-034]
Timing, once the routing is constrained independently. The members release at different times, so arrival would separate them — but only in this order: constrain the routing on the July 2025 corridor event, freeze it before any exposure to the August 2026 timing observations, then add the missing transient-obstruction mechanism and re-evaluate the A/B/C branches against 2026 with no further parameter adjustment. Introducing a transient-plug member first would let a mechanism change absorb a routing error. That work is awaiting approval and is not part of this update.
River Corridor
Source area to Malekhu — the reach under reconstruction
Roughly 100 km of channel from a glacierized source slope to the Trishuli gauges, crossing a transboundary headwater, a contested blockage reach and a densely used highway corridor. Three of the corridor gauges were destroyed before recording the wave.
03 · First major impact zone
Rasuwagadhi / Miteri Bridge
Gauge lost after 08:40, no rise recorded
[E-026]Exposure
What was in the path
Asset classes along the corridor, from what the evidence register supports. Where a quantity is not supported, the asset class is listed as not assessed rather than left out. Human-impact figures are excluded from this page.
Corridor gauges
Four lost: Rasuwagadhi, Syabrubesi and Betrawati stopped transmitting before recording any rise; Malekhu was destroyed mid-rise, so its +7.13 m is a lower bound [E-026 · E-027 · E-028 · E-021]
Bridges
Damage reported along the corridor; count and identity not assessed here. In July 2025 the same corridor lost the Nepal–China Friendship Bridge at Rasuwagadhi [E-121 · E-095]
Highway corridor
Damage reported; length not assessed here. The July 2025 event left 16 km of the Syafrubesi–Rasuwagadhi road impassable [E-121 · E-095]
Dry port (Rasuwagadhi)
Not assessed for 2026. Large sections were damaged in July 2025 [E-095]
Hydropower assets
Damage reported; capacity, outage duration and per-scheme identity not assessed here. Three plants were damaged in the July 2025 event [E-121 · E-095]
Settlements along Rasuwagadhi–Timure–Syabrubesi
Severe damage reported, qualitative only. Human-impact figures are excluded from this page by policy [E-121]
Worked illustration · not a result for any real asset
For a hypothetical intake or barrage sited on the Galchhi reach, the observed forcing is a stage rise of +8.83 m in 30 minutes[E-022], with a screening water-equivalent peak band of ≈4.6–8.3 × 10³ m³/s from the order-of-magnitude hydraulic check (model output, sim-claude edff56c · outputs 4 Sep 2026 · diagnostics 11 Sep 2026). Dam-break amplification of the kind reconstructed at Chungthang for Sikkim is not assessed here, and neither is debris impact loading, sediment burial or intake blockage. This is an illustration of what a consequence assessment takes as input, not an assessment of any asset.
Evidence Consistency
Evidence consistency, per member
Each check is assessed per ensemble member against that member’s own value — never against the envelope. A check with no observation is not-evaluable, not a pass. The point is which observations a member explains or contradicts, not a score. Casualty and missing-person counts are not used as checks.
| Member | Mechanism branch | Timing (3 checks) | Stage (2 checks) | Interpretation |
|---|---|---|---|---|
| low | C · sustained blockage | 0 of 3 consistent | 0 of 2 as run | Too small on stage everywhere, and its wave does not survive to Malekhu. Inconsistent with the observations. |
| medium | C · sustained blockage | 0 of 3 consistent | 0 of 2 as run | Too small on stage at both gauges. Inconsistent with the observations. |
| high | C · sustained blockage | 0 of 3 consistent | 2 of 2 as run | Reaches both stage bands, on upper-end assumptions (6 Mm³ impounded, 40 m dam, rapid collapse, ×2.5 bulking). Arrives hours late. |
| direct | A · continuous propagation | 0 of 3 consistent | 0 of 2 as run · 2 of 2 baseline-corrected | Reaches both stage bands once the baseline defect is removed; overshoots as run. Arrives earliest of the four, still ~2 h late. |
Counts of consistent checks, not a quality rating: a member is not “better” for passing more of five unequal tests. What matters is which observations each member explains and which it contradicts, and the per-check detail below carries that. For reference, the counts of consistent checks out of five evaluable are low 0/5 as run, 0/5 baseline-corrected · medium 0/5 as run, 0/5 baseline-corrected · high 2/5 as run, 2/5 baseline-corrected · direct 0/5 as run, 2/5 baseline-corrected.
Denominator: 2 stage checks + 2 arrival checks + 1 travel-time check; rapid onset moved to internal consistency. It was 3 on 4 September, when the timing checks had no observation; it grows when a check becomes evaluable and is never frozen. The five checks are not independent: Galchhi and Malekhu sample the same propagating wave, and the travel time is the difference of the two arrivals. [E-020 · E-021 · E-025]
Observational checks — per member (as run)
| Check | Observed | low | med | high | direct | Result |
|---|---|---|---|---|---|---|
| Galchhi arrival | Rise onset 10:20–10:30 NPT = T+1.71–1.88 h · tolerance ±30 min [E-020 · E-002] | ✗ | ✗ | ✗ | ✗ | Modelled T+8.19 h · T+6.63 h · T+5.06 h · T+3.96 h. Every member is late; the direct member, released at T0, reaches Galchhi 2.1 h after the observed onset window. |
| Malekhu arrival | Rise onset 11:10–11:20 NPT = T+2.55–2.71 h [E-021 · E-002] | ✗ | ✗ | ✗ | ✗ | Modelled no arrival · T+8.69 h · T+6.59 h · T+5.39 h. The low member has no arrival: its routed wave peaks 2.1 m³/s above baseflow at Malekhu, below the 5 m³/s arrival floor — scored a fail, not excluded. |
| Galchhi → Malekhu travel time | 40–60 min between onsets · tolerance ±20 min [E-025] | ✗ | ✗ | ✗ | ✗ | Modelled — · 123 min · 92 min · 86 min. Insensitive to the onset anchor. The direct member misses the tolerance by 6 min — close, and within the ±10 min sampling uncertainty of each onset. |
| Galchhi stage jump | +8.83 m in 30 min · band 6–12 m [E-022 · E-023] | ✗ | ✗ | ✓ | ✗ | As run: 1.3 m · 3.5 m · 9.9 m · 13.4 m. Only the high member lands in the band as run — on upper-end assumptions (see the Costa & Schuster check). Corrected for the baseline defect, the direct member lands in the band as well. |
| Malekhu stage jump | ≥+7.13 m in 30 min (censored) · band 4–10 m [E-021 · E-024] | ✗ | ✗ | ✓ | ✗ | As run: 0.7 m · 3.4 m · 9.0 m · 12.4 m. Same pattern as Galchhi. The recorded rise is a lower bound — the station was destroyed mid-rise — so the band’s upper limit is not observationally supported. |
Arrival rule (model): the first time the routed flood wave exceeds the larger of 5% of that member’s own peak excess at the station and 5 m³/s, sustained for 5 minutes. Observed arrival: the 10-minute bracket between the last flat and first risen gauge sample. T0 is the slope failure, anchored to the USGS origin. The 4 September page quoted clock times of 12:38–17:11 NPT; that span was built as 08:40 + the fastest member (3.96 h) to 09:00 + the slowest (8.19 h), mixing two onset anchors, and is retired.
Known defect · stage-rise baseline
The routing measures each stage rise from a baseline computed with clear-water roughness on unbulked baseflow, but computes the flood stage with debris roughness on bulked baseflow. Part of every published rise is that switch — a rise that would appear with no flood wave at all. It was found in review on 11 September, after the as-run scores were known. The table quantifies it without re-running anything; adopting a corrected metric and re-running is awaiting approval.
| Station | Member | As run | Baseline artefact | Wave-only rise | Fastest 30-min rise | Band |
|---|---|---|---|---|---|---|
| galchhi | low | 1.31 m | 0.65 m | 0.66 m | 0.52 m | 6–12 m |
| galchhi | medium | 3.53 m | 1.77 m | 1.76 m | 1.41 m | 6–12 m |
| galchhi | high | 9.89 m | 2.89 m | 7.00 m | 6.30 m | 6–12 m |
| galchhi | direct | 13.45 m | 3.58 m | 9.87 m | 9.36 m | 6–12 m |
| malekhu | low | 0.68 m | 0.67 m | 0.01 m | 0.00 m | 4–10 m |
| malekhu | medium | 3.39 m | 1.83 m | 1.56 m | 0.95 m | 4–10 m |
| malekhu | high | 8.99 m | 2.93 m | 6.06 m | 4.32 m | 4–10 m |
| malekhu | direct | 12.36 m | 3.64 m | 8.72 m | 6.80 m | 4–10 m |
The low member’s 0.68 m at Malekhu is 0.67 m of artefact: its wave is effectively gone by Malekhu, which is why it has no arrival there. The 4 September statement that the direct member “overshoots” the band does not survive the correction.
Cross-check — Costa & Schuster (1988) landslide-dam regression [E-110 · E-111 · E-112]
| Member | PE = h · V · 9,800 N/m³ | Costa Qp | Model water peak | Ratio | Breach-only water peak | Model bulked peak (not comparable) |
|---|---|---|---|---|---|---|
| low | 8.82e+10 J | 486 m³/s | 634 m³/s | 1.3× | 594 m³/s (1.22×) | 824 m³/s |
| medium | 3.43e+11 J | 847 m³/s | 2,364 m³/s | 2.79× | 2,324 m³/s (2.74×) | 4,255 m³/s |
| high | 2.35e+12 J | 1,866 m³/s | 10,736 m³/s | 5.75× | 10,696 m³/s (5.73×) | 26,839 m³/s |
Qp = 0.0158 PE^0.41, fitted to 12 landslide dams (r² = 0.81, standard error 185%). Compared only with water discharge: the regression predicts water peaks, and the bulked flux is a different quantity. The direct member has no impoundment, so the regression has no argument there. The high member reaches the downstream stage band only while combining a large impoundment, rapid release and high bulking.
Internal consistency — not scored, not evidence
| Check | Observed | low | med | high | direct | Result |
|---|---|---|---|---|---|---|
| Rapid onset | Sudden release, not a rainfall hydrograph | ✓ | ✓ | ✓ | ✓ | 3.2–20.9 min at the source reach. Every member is a sudden release by construction, so the check confirms the boundary condition and cannot separate members. Moved here from the observational score on 11 September. |
| Travel distance | About 100 km (USGS, provisional) | — | — | — | — | 127.9 km in every member — set by where the corridor stops, not where the wave dies. Not evidence. |
| Mechanism labelled, not asserted | Completeness check on our own reporting | ✓ | ✓ | ✓ | ✓ | Carried as provisional scenario labels: two modelled branches (A continuous propagation, C sustained blockage) within a three-branch hypothesis space. |
| Secondary signal representable | Second landslide-type signal at 11:45:35 NPT | ✓ | ✓ | ✓ | ✓ | A secondary pulse at T+3 h; its volume is assumed. Not related to the barrier-lake overflow of 28 August. |
| Impacted corridor represented | Damage along Rasuwagadhi–Timure–Syabrubesi | ✓ | ✓ | ✓ | ✓ | All five corridor settlements carried as routing stations. |
What the ensemble says
No member passes a timing check, and the member released earliest is still more than two hours late at Galchhi. The bias is shared by both mechanism branches, so it is not evidence for either: it points to the corridor-routing configuration common to all four members, without yet isolating which part of it is wrong. On stage magnitude, the low and medium blockage members fail under every metric. The high blockage member passes on upper-end assumptions; the direct member fails as run and passes once a known baseline defect is removed. The stage checks therefore cannot choose between the high blockage member and the direct member, and the timing checks cannot be used for that until the routing is calibrated on an independent event. Neither statement is a conclusion about what happened on 26 August.
Reading The Model
What this model does and does not resolve
A screening solver used for hypothesis testing and diagnostics. Stated plainly so that no capability is attributed to it that it does not claim.
The model resolves
- network-scale flood propagation down a 127.9 km corridor
- alternative release scenarios across mechanism families
- first-order attenuation between stations
- arrival and peak timing per member
- approximate stage / discharge consistency at the gauges
The model does not resolve
- 2D inundation extent or channel avulsion
- sediment erosion and deposition
- granular debris mechanics and non-Newtonian rheology
- an evolving channel blockage or dynamic breach formation
- true cross-section hydraulics and high-resolution valley geometry
How debris is represented
The routed quantity is a bulked volume flux: Qbulked = Qwater × B, with B constant per member (×1.3 to ×3.0) and applied to both discharge and wave volume. Resistance is raised with it, neff = n (1 + 0.6 (B − 1)). Both are empirical screening conventions, not derived relations: the flow is still solved hydraulically as water with modified resistance. Solids are not conserved separately, density is not tracked, and B does not vary by reach.
The solver does not resolve non-Newtonian debris-flow rheology. Sediment and debris enter only through bulk-volume and effective-resistance proxies, so the results are flood-propagation screening rather than a debris-flow simulation.
What “uncalibrated” means here
No model parameter was adjusted to match the Galchhi or Malekhu stage or arrival observations. Scenario parameters — impounded volume, blockage height, breach mode and duration, bulking, the mobilised volume of the direct member — were chosen as screening assumptions before those observations were used, and the arrival tolerances were fixed before any timestamp was recovered.
Two things do come from outside this event, and are not observations of it: channel widths and monsoon baseflow are assumed by reach class and seasonal magnitude, and Manning resistance follows conventional values for the reach types. Scenario selection itself is disclosed rather than treated as neutral: all four members were specified after the reported stage rises were public.
Order-of-magnitude hydraulic consistency check
Not a discharge reconstruction or a gauge rating: a screening calculation that tests whether the simulated flood magnitude is physically compatible with the observed stage rise. It inverts Manning normal depth at the reported rise on a compound section, and it is sensitive to every assumption listed beside it, so only the order of magnitude is meaningful.
| Station | Observed rise | Implied peak · clear-water discharge | Implied peak · debris-bulked volume flux (×1.8–2.5) | Implied peak · water-equivalent discharge (×1.8–2.5) | Water-equivalent flood volume, 1–3 h wave | Assumptions |
|---|---|---|---|---|---|---|
| galchhi | +9 m | ≈2 × 10⁴ m³/s | ≈1.2–1.5 × 10⁴ m³/s | ≈4.6–8.3 × 10³ m³/s | ≈7–115 Mm³ | compound section: rectangular channel 110 m wide to 4.0 m bankfull, then valley berm 4.0x width with n x 1.3; slope 0.004142 (SRTM 90 m long profile); n 0.038; baseflow 700 m³/s; triangular excess wave above bulked baseflow |
| malekhu | +7 m (censored) | ≈1 × 10⁴ m³/s | ≈7.7–9.9 × 10³ m³/s | ≈3.1–5.5 × 10³ m³/s | ≈4–75 Mm³ | compound section: rectangular channel 130 m wide to 4.0 m bankfull, then valley berm 4.0x width with n x 1.3; slope 0.002523 (SRTM 90 m long profile); n 0.035; baseflow 750 m³/s; triangular excess wave above bulked baseflow |
The baseline stage in this inversion uses the same clear-water convention as the stage-rise defect below, so it carries the same bias. Volumes are water-equivalent; the bulked-flux volumes are larger by the bulking factor.
Reconstruction Method
How the reconstruction was built
South Lhonak gave VARUNA a lake-breach pathway. Rasuwa needed a landslide-dam and debris-rich routing pathway alongside it, so the case was built as its own study rather than by bending the Sikkim defaults. Every stage is screening-level.
Evidence register
Refreshed 11 SepEvery external datum carries source URL, publisher, published date, event time, accessed date, source tier, confidence and permitted use. Tier 2 and 3 sources never support an observational check. Casualty, missing-person and displacement figures are excluded entirely. In operator terms: every published value is dated, tiered, sourced and version-linked, and every superseded interpretation stays visible with the reason it was withdrawn. After an event a warning system is reviewed by a board, an insurer or a regulator, and the question is what was known when — this structure is what answers it.
Corridor and long profile
Done127.9 km from the source reach to Malekhu: planform from OpenStreetMap river centerlines, long profile sampled from SRTM 90 m. SRTM-era topography predates the 2015 earthquake and the channel-changing floods since, including July 2025. The suspected blockage sits at the reported ~20 km above the Miteri Bridge; a second report of ~10 km is not used.
Trigger module — scenario bands
DoneThe trigger is carried as labelled scenario bands — impounded water, blockage height, breach mode, bulking — not as an identified mechanism, and the bands populate branches A and C only. No failure polygon is digitised and no collapse volume is claimed. The medium member was centred on a figure now known to describe a post-event pond; the band is retained as a scenario, not as a reported value.
Landslide-dam breach hydrographs
DoneReservoir routing through a growing trapezoidal breach with a broad-crested weir law, mass-conserving, across three blockage modes. A fourth member assumes no impoundment and is driven by an assumed hydraulically mobilised volume. Breach-only water peaks are cross-checked against Costa & Schuster (1988), verified from the original paper.
Debris-rich routing
Done · defect foundMuskingum-Cunge routing from the South Lhonak case with a bulking ratio and debris roughness; stage from a compound channel-and-valley Manning proxy. A screening model — a final reconstruction needs a two-phase mass-flow solver. Known defect: the stage baseline uses clear-water roughness on unbulked baseflow while the flood series uses debris roughness on bulked baseflow.
Evidence-consistency and uncertainty report
Re-assessed 11 SepEvery check assessed per member, never against the envelope. Timing checks are now evaluable against DHM telemetry, with the tolerances fixed on 4 September before any timestamp was known. Rapid onset joins travel distance as internal consistency because it cannot separate members. “Validation” is reserved for a later stage, when the model architecture is frozen and evaluated against independent events or withheld data.
Review diagnostics
New · read-onlyA post-processing script over the committed 4 September outputs: volume and discharge types, the arrival rule, the stage-baseline defect, the Costa & Schuster cross-check and the timing scores. It re-runs nothing and changes no parameter.
Corridor History
The same corridor, fourteen months earlier
On 8 July 2025 a flood from a different source destroyed the Friendship Bridge at Rasuwagadhi. The two events had different mechanisms; what they share is the corridor and its evolving source zones.
When
8 July 2025; first reported impact at the Rasuwagadhi border post about 03:15 NPT [E-093]
Source
Supraglacial lake system on the Purepu Glacier, upper Lende catchment, Tibet (China), ~5,160 m [E-094 · E-090]
Trigger
Supraglacial lake outburst — High confidence: NDRRMA situation report and a peer-reviewed field and remote-sensing study. A 2026 preprint notes englacial or subglacial water cannot be excluded; that concerns flood volume, not the source. [E-090 · E-091 · E-092]
Damage corridor
Nepal–China Friendship Bridge destroyed; Rasuwagadhi dry port and three hydropower plants damaged; 16 km of road [E-095]
Relation to 2026
Same catchment and corridor, different glacier. The 2026 detachment lies north of the Lirung massif; HiRISK reports the 2026 mass flow met the 2025 flood deposits. USGS notes that the same mountain produced the 2015 earthquake-triggered avalanche — the same mountain, not the same slope. [E-078 · E-098 · E-100 · E-101]
Two major cryosphere-related cascade events reaching the same corridor within roughly 14 months illustrate why monitoring the corridor and its evolving source zones may be more useful than monitoring named lakes alone. For this reconstruction the 2025 flood matters twice over: its channel changes post-date the SRTM terrain the routing uses, and — if DHM records exist — it is the independent event on which the routing could be calibrated before 2026 is re-run.
Missing-Data Register
What we do not have yet
Publishing the gaps is part of the product. An item is closed only when it is genuinely sourced; each carries why it matters and the interim workaround.
Flow record above Rasuwagadhi, 25–26 August
Why The observation that would test a dam formed on 25 August: a sustained impoundment should cut flow downstream for hours. The public DHM endpoint no longer holds series before 26 August.
Interim Pre-event stage was falling at three gauges on 26 August — non-diagnostic without the preceding days and hydropower operating records
[E-034 · E-019]Main-event water store
Why Release volume under the blockage hypothesis. No pre-flood lake or impoundment has been observed; every quantified lake was measured from 27 August onward.
Interim Blockage members carried as scenario bands (0.6–6.0 Mm³ impounded water), not as reported values
[E-050 · E-056]Exact failure polygon
Partly availableWhy Collapse volume and runout geometry
Interim UNOSAT detachment-zone polygon (≈1.96 km², area only) available in its geodatabase; not yet adopted
[E-077]Full gauge hydrographs and rating curves
Why Converting stage to discharge at Galchhi and Malekhu; testing the Manning inversion
Interim Normal-depth proxy under stated assumptions; Galchhi is an elevation-type gauge with no published rating
[E-022]Observed inundation boundary
Products exist, none adoptedWhy Spatial consistency checking
Interim Not yet adopted — definitions differ: UNOSAT floodwater/mudflow/rockflow extent (64.9 km², cumulative, rolling), Copernicus EMS mass-movement extent, JAXA ALOS-2 flood-water proxy; USGS mapping underway
[E-082 · E-083 · E-084 · E-080]High-resolution pre/post DEM
AcquirableWhy Source volume, erosion and deposition; the routing terrain predates the 2015 earthquake and the 2025 flood
Interim SRTM for the first pass; stereo photogrammetry requested. Acquirable in principle from commercial stereo, not from free imagery
Earth-observation corridor change set
BlockedWhy The one quantity still measurable at every point, including the three reaches where telemetry died: what the corridor looks like now, and the same for July 2025 as an independent calibration target
Interim Not deliverable from free imagery. Sentinel-2 indices cannot delineate this turbid channel — a 110 m perennial reach and a hillslope return the same class, so a first width attempt was discarded rather than published. Needs Planet or WorldView optical, or calibrated SAR (no terrain-correction toolchain here; Planetary Computer RTC assets refuse anonymous access)
[E-047 · E-046]EO standing limit
Method noteWhy Earth observation constrains corridor geometry and change extent. It never constrains discharge or timing, and the before-phase supports susceptibility and siting rather than prediction
Interim Any EO product adopted here inherits that boundary; timing claims stay tied to observed gauge arrivals
[E-046]2025 gauge records, Galchhi and Malekhu
Why An independent same-corridor routing calibration, so 2026 timing can be tested without tuning to 2026
Interim Not public; DHM data request. The calibration exercise itself is approval-gated
[E-096]Warning message timestamps
Partly availableWhy Early-warning performance analysis
Interim DHM reports warnings issued from 09:15; official alert logs still requested
[E-033]Comparison
Sikkim 2023 and Nepal 2026, side by side
Two cascades, one cascade class. The comparison is what turns a single reconstruction into a monitoring requirement.
| Feature | Sikkim 2023 · South Lhonak | Nepal 2026 · Rasuwa / Bhote Koshi |
|---|---|---|
| Main trigger | Lateral moraine / ice-rock collapse into lake | Rapid slope failure involving glacierised terrain (provisional; USGS wording revised 28 Aug) |
| Source process | Collapse into an existing lake | One initiating ice-rock slope failure; three possible consequences — A continuous propagation, B a minutes-scale transient plug (not modelled), C sustained blockage and breach |
| Primary water store | Existing proglacial lake | A/B: failure mass, melt and entrained channel water · C: impounded water behind a blockage, none observed before the flood. Post-event lakes observed from 27 Aug are not the main-event store |
| Breach / release type | Moraine dam overtopping and erosion | A: no breach — a debris-rich wave · B: release of a plug lasting minutes · C: landslide-dam collapse or overflow |
| Routing corridor | Teesta River | Lende Khola, Bhote Koshi, Trishuli |
| Key consistency checks | Breach Q, lake volume drained, Chungthang timing, Rangpo stage | Galchhi and Malekhu rise onset and stage jumps (DHM telemetry); both sample one wave |
| Infrastructure cascade | Chungthang / Teesta III dam-break amplification | Bridges, highway, hydropower and gauges; dam-break amplification not assessed |
| Product lesson | Monitor unstable moraine-lake systems before overtopping | Monitor the corridor and its evolving source zones, not a named lake |
The Sikkim reconstruction is live and interactive — open the South Lhonak cascade simulation.
Where This Leaves The Case
What the reconstruction yields so far
This event does not yet yield a single validated reconstruction. It yields something more useful operationally: evidence that a glacierised slope failure can generate a rapid transboundary river cascade with no known pre-existing glacial lake, while temporary channel obstruction and downstream channel processes remain the central uncertainties.
The first ensemble did its job. It showed where the evidence can discriminate between the hypotheses and where the model cannot. Gauge timing recovered after the members were configured is inconsistent with the propagation behaviour all four of them share, which means the corridor hydraulics have to be constrained before the model can be used to infer the source mechanism. The next iteration is therefore a diagnostic experiment — a minutes-scale transient-plug member and a systematic routing sensitivity study — not a roughness value tuned until the arrivals line up.
For early warning the implication is unchanged by any of that: the monitored object cannot only be a lake. It has to be the evolving physical state of the whole source–channel–corridor system.
For A Corridor Of Your Own
What a fleet operator can establish now
Screening-level, on the same procedure as this page. Each line is an outcome, not a service.
- which of your corridors have source zones a lake inventory would miss
- where your corridor is instrumentally blind, and which gauges survive a wave
- what lead time your current detection chain would actually deliver, reconstructed against a recorded event on your own reach
- which reaches need corridor-calibrated routing before any warning threshold can be trusted
- what a consequence assessment at a specific intake or barrage would require as input
Research collaboration, data sharing or an operational assessment for the Bhote Koshi and Trishuli corridor — or for your own reach.
Get in TouchEvidence Snapshot
What is known, and how well
A subset of the evidence register, rendered from it. Tier 2 and 3 sources are used for narrative context or scenario bounds only; formal observational checks rely on primary or suitable near-primary evidence. The full register (99 entries) is at the foot of the page.
| ID | Item | Value | Event time | Tier | Confidence | Use | Source |
|---|---|---|---|---|---|---|---|
| E-001 | Event date | 2026-08-26 date | 2026-08-26 | Primary | High | narrative only | Government of Nepal, Ministry of Home Affairs ↗ |
| E-002 | ComCat us7000tbwb origin time | 2026-08-26T02:52:10Z (= 2026-08-26 08:37:10 NPT, UTC+05:45) UTC | 2026-08-26T02:52:10Z | Primary | High | timing reference | USGS NEIC (ComCat) ↗ |
| E-004 | ComCat us7000tc90 origin time | 2026-08-26T06:00:35Z (= 2026-08-26 11:45:35 NPT) UTC | 2026-08-26T06:00:35Z | Primary | High | narrative only | USGS NEIC (ComCat) ↗ |
| E-005 | USGS event classification (current page wording, findings as of 8/28/26) | catastrophic debris flow and flood likely triggered by rapid slope failure involving a glacier | 2026-08-26 | Primary | Medium | narrative only | USGS Landslide Hazards Program ↗ |
| E-008 | USGS travel distance of debris flow and flood | approximately 100 km | 2026-08-26 | Primary | Medium | narrative only | USGS Landslide Hazards Program ↗ |
| E-020 | Galchi (Trishuli at Galchi) gauge rise onset | last pre-rise 360.623 m @10:20 NPT; first risen 363.583 m @10:30 NPT m (station datum; values ~361 suggest elevation-referenced) | 2026-08-26T10:30:00+05:45 | Primary | High | timing diagnostic | DHM / CHWRR (telemetry) ↗ |
| E-022 | Galchi gauge peak and rise duration | peak 369.451 m @10:50 NPT; rise +8.83 m from 10:20 to 10:50 (30 min); 11:00 369.381; back to 363.0 by 12:50 m | 2026-08-26T10:50:00+05:45 | Primary | High | stage observational check | DHM / CHWRR (telemetry) ↗ |
| E-021 | Malekhu (Trishuli at Furke Khola) gauge rise onset | last pre-rise 3.351 m @11:10 NPT; 3.963 m @11:20; 7.781 m @11:30; 10.482 m @11:40 (last value) m | 2026-08-26T11:20:00+05:45 | Primary | High | timing diagnostic | DHM / CHWRR (telemetry) ↗ |
| E-023 | ICIMOD: Galchhi water-level rise (magnitude and duration) | ~9 ("as much as nine metres") within 30 minutes m | 2026-08-26T10:20:00+05:45/2026-08-26T10:50:00+05:45 | Near-primary | Medium | corroboration | ICIMOD ↗ |
| E-026 | Rasuwagadi (Bhotekoshi at Rasuwagadi) last telemetry | 1.620 m @08:40 NPT (02:55Z); 18 values 05:50-08:40, slowly falling from 1.776 m; nothing after m | 2026-08-26T08:40:00+05:45 | Primary | High | narrative only | DHM / CHWRR (telemetry) ↗ |
| E-040 | DHM: debris blocked river ~20 km upstream of Miteri Bridge (Chinese imagery) | 20 km upstream of Miteri Bridge | 2026-08-26 | Secondary | Low-Medium | scenario bound | The Kathmandu Post (DHM FFD chief Binod Parajuli) ↗ |
| E-041 | DHM: Lende Khola blockage ~10 km upstream of Miteri Bridge, Tibetan side | 10 km upstream of Miteri Bridge | 2026-08-26 | Secondary | Low-Medium | narrative only | HimalPress English (DHM Flood Forecasting Division, Binod Parajuli) ↗ |
| E-050 | Impact-crater pond storage volume (the '1.4 Mm3' figure) - English origin | 1.4 million m3 | 2026-08-30T11:23:00+08:00 | Near-primary | Medium | narrative only | Xinhua (relaying China Ministry of Water Resources) ↗ |
| E-054 | UNOSAT 4260 barrier lake 1 (near Nepal-China border) area | approximately 12 (map inset label 11.92 ha; 990 m x 253 m) ha | 2026-08-28 | Primary | High | narrative only | UNOSAT (UNITAR) ↗ |
| E-056 | Lower (Puripu Qiangzangbu / Chhochen-Purepu confluence) barrier lake volume, 27 Aug morning | 2 million m3 | 2026-08-27 | Near-primary | Medium | narrative only | Global Times (citing MWR via CCTV) ↗ |
| E-032 | DHM report: Devghat flood volumes (total and excess over base flow) | total ~57.40 Mm3; excess ~19.96 Mm3; base flow 2,600 m3/s; window 14:10-18:00 NPT million m3 | — | Primary | Medium | narrative only | Flood Forecasting Division, Centre for Hydrology and Water Resources Research (CHWRR, formerly DHM), Govt of Nepal ↗ |
| E-070 | Seismic-inversion source volume (regional stations) | 284-492 Mm3 bulk source volume | 2026-08-26T08:37:10+05:45 | Near-primary | Low-Medium | narrative only | CLaSH StoryMap (analysis/figure by Christopher Calvelage, EarthScope) ↗ |
| E-074 | CU Boulder Today: 50 million metric tons of ice, rock and water (earliest instance found) | 50 million metric tons (equated to ~13 billion US gallons) | 2026-08-26 | Tertiary | Low | narrative only | CU Boulder Today (university news Q&A with Alton Byers, INSTAAR) ↗ |
| E-120 | Rainfall role | not a regular rainfall flood; no heavy rainfall reported immediately before the event | 2026-08-26 | Secondary | Medium | narrative only | Kathmandu Post (reporting DHM) ↗ |
Source Register
Where every number on this page comes from
Key sources below; every externally sourced value resolves to an entry in the full evidence register (99 entries, external evidence as of 2026-09-11, register updated 2026-09-13 with derivations only). Model values resolve to sim-claude edff56c · outputs 4 Sep 2026 · diagnostics 11 Sep 2026.
Full evidence register · 99 entries · JSON
| ID | Item | Value | Event time | Published | Tier | Confidence | Use | Dependence | Source |
|---|---|---|---|---|---|---|---|---|---|
| E-001 | Event date | 2026-08-26 date | 2026-08-26 | 2026-08-26 | Primary | High | narrative only | — | Government of Nepal, Ministry of Home Affairs ↗ |
| E-002 | ComCat us7000tbwb origin time | 2026-08-26T02:52:10Z (= 2026-08-26 08:37:10 NPT, UTC+05:45) UTC | 2026-08-26T02:52:10Z | 2026-08-26 | Primary | High | timing reference | independent | USGS NEIC (ComCat) ↗ |
| E-003 | ComCat us7000tbwb magnitude | 5.2 (magType ms_vx; magnitude-error 0.09; 26 stations) magnitude | 2026-08-26T02:52:10Z | 2026-08-26 | Primary | High | narrative only | — | USGS NEIC (ComCat) ↗ |
| E-004 | ComCat us7000tc90 origin time | 2026-08-26T06:00:35Z (= 2026-08-26 11:45:35 NPT) UTC | 2026-08-26T06:00:35Z | 2026-08-27 | Primary | High | narrative only | — | USGS NEIC (ComCat) ↗ |
| E-005 | USGS event classification (current page wording, findings as of 8/28/26) | catastrophic debris flow and flood likely triggered by rapid slope failure involving a glacier | 2026-08-26 | 2026-08-27 | Primary | Medium | narrative only | — | USGS Landslide Hazards Program ↗ |
| E-006 | USGS event classification (EARLIER wording, findings as of 8/27/26; later revised) | catastrophic debris flow and flood likely triggered by a glacial collapse | 2026-08-26 | 2026-08-27 | Primary | Low-Medium | narrative only | — | USGS Landslide Hazards Program ↗ |
| E-007 | USGS statement on uncertainty of initiation type (8/28 version) | unclear whether landslide incorporating part of a glacier or a glacial collapse | 2026-08-26 | 2026-08-27 | Primary | Qualitative | narrative only | — | USGS Landslide Hazards Program ↗ |
| E-008 | USGS travel distance of debris flow and flood | approximately 100 km | 2026-08-26 | 2026-08-27 | Primary | Medium | narrative only | — | USGS Landslide Hazards Program ↗ |
| E-009 | USGS description of flow transformation (mechanism-relevant) | glacial debris with water and ice melted and entrained material/water in existing channels -> fast-moving far-travelled landslide and flood | 2026-08-26 | 2026-08-27 | Primary | Qualitative | narrative only | — | USGS Landslide Hazards Program ↗ |
| E-010 | ComCat us7000tbwb location | lat 28.271, lon 85.515, depth 0 km; place "55 km NW of Kodari, Nepal"; location estimated from satellite images degrees | 2026-08-26T02:52:10Z | 2026-08-26 | Primary | Medium | narrative only | — | USGS NEIC (ComCat) ↗ |
| E-011 | DHM press release: avalanche source coordinates | snow avalanche near border at N 28°16'50", E 85°32'15.45" | — | 2026-08-27 | Primary | Low-Medium | narrative only | — | Flood Forecasting Division, Centre for Hydrology and Water Resources Research (CHWRR, formerly DHM), Govt of Nepal ↗ |
| E-012 | DHM press release: M2.6 and M4.4 earthquakes near Rasuwagadhi (source DMG) | M2.6 at 08:20; M4.4 at 08:37 NPT (Richter), near Rasuwagadhi border area | 2026-08-26T08:37:00+05:45 | 2026-08-27 | Primary | Medium | narrative only | — | Flood Forecasting Division, Centre for Hydrology and Water Resources Research (CHWRR, formerly DHM), Govt of Nepal ↗ |
| E-013 | ICIMOD: anomalous seismic signals at Jilong and Zhangmu | anomalous signals at Jilong seismometer (~12 km from affected area) and unusual activity at Zhangmu | 2026-08-26 | 2026-08-26 | Near-primary | Qualitative | narrative only | — | ICIMOD ↗ |
| E-014 | ICIMOD: flood onset and stage rise (reported) | Bhote Koshi rise began ~09:00 NPT; Trishuli at Galchhi rose up to 9 m within 30 min; Malekhu 7 m over similar period | 2026-08-26 | 2026-08-26 | Near-primary | Low-Medium | narrative only | — | ICIMOD ↗ |
| E-015 | NDRRMA SitRep #01: avalanche location, detached area, lake formation after the event | 20 km upstream of Rasuwagadhi; ~1 km2 detached section | 2026-08-26T08:40:00+05:45 | 2026-09-01 | Primary | High | narrative only | — | NDRRMA Situation Report #01 ↗ |
| E-016 | Collapse time and runout to Gyirong Port (CAS IMHE via Xizang press conference) | collapse ~10:52 BJT (08:37 NPT) at ~5,200 m; ~22 km to Gyirong Port in about 6-7 min | 2026-08-26T10:52:00+08:00 | 2026-08-30 | Near-primary | Medium | narrative only | — | CGTN (Xizang news conference; CAS Institute of Mountain Hazards and Environment) ↗ |
| E-017 | Guo Zhaocheng: signal start 10:52, Gyirong video impact 10:59; source ~5,140 m | 7 minutes | 2026-08-26T10:52:00+08:00 | 2026-08-27 | Secondary | Medium | narrative only | — | CCTV/Xinhua via Dazhong Daily live blog (expert Guo Zhaocheng; affiliation not captured in retrieved text) ↗ |
| E-018 | ADRC overview: temporary dam breach time | temporary dam breach 08:30-08:37 NPT, 26 Aug | 2026-08-26T08:30:00+05:45 | 2026-09-08 | Secondary | Low-Medium | narrative only | — | Asian Disaster Reduction Center (sourcing IRDR rapid analysis, 28 Aug) ↗ |
| E-019 | ADRC/IRDR: mass failure and dam formation 25 Aug | mass failure and dam formation 25 Aug 13:00-14:00 NPT; impoundment ~18-19 h (IRDR via ADRC) | 2026-08-25T13:00:00+05:45 | 2026-09-08 | Secondary | Low | narrative only | — | ADRC (citing IRDR 28 Aug) ↗ |
| E-020 | Galchi (Trishuli at Galchi) gauge rise onset | last pre-rise 360.623 m @10:20 NPT; first risen 363.583 m @10:30 NPT m (station datum; values ~361 suggest elevation-referenced) | 2026-08-26T10:30:00+05:45 | — | Primary | High | timing diagnostic | same event correlated | DHM / CHWRR (telemetry) ↗ |
| E-021 | Malekhu (Trishuli at Furke Khola) gauge rise onset | last pre-rise 3.351 m @11:10 NPT; 3.963 m @11:20; 7.781 m @11:30; 10.482 m @11:40 (last value) m | 2026-08-26T11:20:00+05:45 | — | Primary | High | timing diagnostic | same event correlated | DHM / CHWRR (telemetry) ↗ |
| E-022 | Galchi gauge peak and rise duration | peak 369.451 m @10:50 NPT; rise +8.83 m from 10:20 to 10:50 (30 min); 11:00 369.381; back to 363.0 by 12:50 m | 2026-08-26T10:50:00+05:45 | — | Primary | High | stage observational check | same event correlated | DHM / CHWRR (telemetry) ↗ |
| E-023 | ICIMOD: Galchhi water-level rise (magnitude and duration) | ~9 ("as much as nine metres") within 30 minutes m | 2026-08-26T10:20:00+05:45/2026-08-26T10:50:00+05:45 | 2026-08-26 | Near-primary | Medium | corroboration | same event correlated | ICIMOD ↗ |
| E-024 | ICIMOD: Malekhu water-level rise (magnitude and duration) | ~7 over 'a similar period' (~30 min) m | 2026-08-26T11:10:00+05:45/2026-08-26T11:40:00+05:45 | 2026-08-26 | Near-primary | Medium | corroboration | same event correlated | ICIMOD ↗ |
| E-025 | Derived: gauge rise-onset differences along corridor (not travel speeds) | Galchi->Malekhu ~50 min (+/-10); Malekhu->Kali Khola ~2 h (+/-10 min); Kali Khola->Devghat ~1 h (+/-20 min) min | 2026-08-26T10:20:00+05:45/2026-08-26T11:20:00+05:45 | — | Primary | Medium | timing diagnostic | partially dependent | GOATAI derivation from DHM 10-min telemetry ↗ |
| E-026 | Rasuwagadi (Bhotekoshi at Rasuwagadi) last telemetry | 1.620 m @08:40 NPT (02:55Z); 18 values 05:50-08:40, slowly falling from 1.776 m; nothing after m | 2026-08-26T08:40:00+05:45 | — | Primary | High | narrative only | — | DHM / CHWRR (telemetry) ↗ |
| E-027 | Syabrubesi (Bhote Koshi at Shyaprubesi) last telemetry | 3.804 m @08:50 NPT (03:05Z); no rise; nothing after m | 2026-08-26T08:50:00+05:45 | — | Primary | High | narrative only | — | DHM / CHWRR (telemetry) ↗ |
| E-028 | Betrawati (Trishuli at Betrawati) last telemetry | 3.549 m @09:20 NPT (03:35Z); flat 3.52-3.56 m since 08:30; nothing after m | 2026-08-26T09:20:00+05:45 | — | Primary | High | narrative only | — | DHM / CHWRR (telemetry) ↗ |
| E-029 | DHM press release: Furke (Malekhu) threshold crossings and max | warning (7 m) at 11:20; danger (8 m) at 11:40; max 10.48 m, then station swept away m | 2026-08-26T11:40:00+05:45 | 2026-08-27 | Primary | High | narrative only | — | Flood Forecasting Division, Centre for Hydrology and Water Resources Research (CHWRR, formerly DHM), Govt of Nepal ↗ |
| E-030 | DHM report: Phurke (Malekhu) warning-level crossing | 11:26 NPT | 2026-08-26T11:26:00+05:45 | 2026-08-26 | Primary | Medium | narrative only | — | Flood Forecasting Division, Centre for Hydrology and Water Resources Research (CHWRR, formerly DHM), Govt of Nepal ↗ |
| E-031 | DHM report: Devghat peak stage | 6.57 m at 16:00 NPT, then falling m | 2026-08-26T16:00:00+05:45 | 2026-08-26 | Primary | High | narrative only | — | Flood Forecasting Division, Centre for Hydrology and Water Resources Research (CHWRR, formerly DHM), Govt of Nepal ↗ |
| E-032 | DHM report: Devghat flood volumes (total and excess over base flow) | total ~57.40 Mm3; excess ~19.96 Mm3; base flow 2,600 m3/s; window 14:10-18:00 NPT million m3 | — | 2026-08-26 | Primary | Medium | narrative only | — | Flood Forecasting Division, Centre for Hydrology and Water Resources Research (CHWRR, formerly DHM), Govt of Nepal ↗ |
| E-033 | DHM: information of flood entry received by Flood Forecasting Division | 09:05 NPT (sec.1); timeline row 09:00 (DAO Rasuwa + Betrawati station staff); warnings from 09:15 | 2026-08-26T09:05:00+05:45 | 2026-08-26 | Primary | High | narrative only | — | Flood Forecasting Division, Centre for Hydrology and Water Resources Research (CHWRR, formerly DHM), Govt of Nepal ↗ |
| E-034 | Pre-event stage trend, 05:50 NPT to flood onset | falling at Rasuwagadhi (1.776 -> 1.620 m by 08:40), Galchhi (361.97 -> 360.62 m by 10:20) and Malekhu (4.32 -> 3.35 m by 11:10) m | 2026-08-26T05:50:00+05:45/2026-08-26T11:10:00+05:45 | — | Primary | Medium | narrative only | — | DHM Nepal (10-min telemetry, provisional) ↗ |
| E-035 | Galchhi stage duration above pre-flood level | more than 1 m above the 10:20 pre-rise level (360.623 m) from the 10:30 sample through the 13:30 sample; below it by 13:40 h (about 3) | 2026-08-26T10:30:00+05:45/2026-08-26T13:40:00+05:45 | — | Primary | Medium | narrative only | — | DHM Nepal (10-min telemetry, provisional) ↗ |
| E-036 | Devghat (Narayani) gauge rise onset | last flat 4.639 m @14:10 NPT; rising from 14:20 (4.656 m), clear by 14:40 (4.800 m) m | 2026-08-26T14:20:00+05:45 | — | Primary | Medium | narrative only | — | DHM Nepal (10-min telemetry, provisional) ↗ |
| E-037 | Derived: detection-chain intervals from T0 | T0 to institutional awareness 23-28 min (09:00-09:05 NPT); T0 to first warnings issued 38 min (09:15 NPT) min | 2026-08-26T08:37:10+05:45/2026-08-26T09:15:00+05:45 | — | Primary | Medium | narrative only | — | GOATAI derivation from E-002 and E-033 ↗ |
| E-038 | Derived: lead time between first warning issued and local gauge rise onset | Galchhi 65-75 min; Malekhu 115-125 min; Devghat about 295-305 min (E-025 reach offsets give a consistent 265-335 min window) min | 2026-08-26T09:15:00+05:45/2026-08-26T14:20:00+05:45 | — | Primary | Medium | narrative only | — | GOATAI derivation from E-033, E-020, E-021, E-036, E-025 ↗ |
| E-039 | Derived: telemetry-loss sequence along the corridor | Rasuwagadhi last transmission 08:40 (T+3 min), Syabrubesi 08:50 (T+13 min), Betrawati 09:20 (T+43 min); strictly downstream order; none recorded a rise. Apparent mean celerity over the 45.8 km between the first and last loss, on model chainage, 19 m/s (24.6 m/s Rasuwagadhi to Syabrubesi, 17.2 m/s Syabrubesi to Betrawati) min; m/s | 2026-08-26T08:40:00+05:45/2026-08-26T09:20:00+05:45 | — | Primary | Low-Medium | narrative only | — | GOATAI derivation from E-026, E-027, E-028 and the corridor chainage of sim-claude edff56c ↗ |
| E-040 | DHM: debris blocked river ~20 km upstream of Miteri Bridge (Chinese imagery) | 20 km upstream of Miteri Bridge | 2026-08-26 | 2026-08-26 | Secondary | Low-Medium | scenario bound | — | The Kathmandu Post (DHM FFD chief Binod Parajuli) ↗ |
| E-041 | DHM: Lende Khola blockage ~10 km upstream of Miteri Bridge, Tibetan side | 10 km upstream of Miteri Bridge | 2026-08-26 | 2026-08-26 | Secondary | Low-Medium | narrative only | — | HimalPress English (DHM Flood Forecasting Division, Binod Parajuli) ↗ |
| E-042 | NDRRMA: snow-rock landslide ~20 km NE of Rasuwagadhi (26 Aug) | 20 km northeast of Rasuwagadhi border crossing | 2026-08-26 | 2026-08-26 | Secondary | Medium | narrative only | — | OnlineKhabar English (NDRRMA, citing Planet Labs imagery) ↗ |
| E-043 | ICIMOD statement on possible blockage (mechanism-relevant) | experts assessing whether debris temporarily blocked river at a narrow section forming a landslide dam | 2026-08-26 | 2026-08-26 | Near-primary | Qualitative | narrative only | — | ICIMOD ↗ |
| E-044 | DHM report: blockage/lake status from China | 13:35 NPT: per information from China side, lake at river-blockage site not yet fully drained | 2026-08-26T13:35:00+05:45 | 2026-08-26 | Primary | Qualitative | narrative only | — | Flood Forecasting Division, Centre for Hydrology and Water Resources Research (CHWRR, formerly DHM), Govt of Nepal ↗ |
| E-045 | Derived: interval between seismic origin and first warning issued | 37.8 min (08:37:10 NPT origin to 09:15 NPT first warnings) min | 2026-08-26T08:37:10+05:45/2026-08-26T09:15:00+05:45 | — | Primary | Medium | narrative only | — | GOATAI derivation from E-002 and E-033 ↗ |
| E-046 | Sentinel-2 L2A scene availability over the corridor, by window | 27 Aug-13 Sep 2026 (post-event): 0 scenes below 40% cloud. 1 Apr-20 Jun 2026 (pre-event): 55. 1 Jun-7 Jul 2025 (pre-2025-event): 8. 9 Jul-30 Sep 2025 (post-2025-event): 16, best 1.0% on 26 Sep 2025 scene count | 2026-08-27/2026-09-13 | — | Primary | High | narrative only | — | GOATAI census of the Element84 Earth Search STAC catalogue (Sentinel-2 L2A, AWS open data) ↗ |
| E-047 | Sentinel-2 spectral water indices fail over this turbid corridor (negative result) | At the Galchhi channel centre green 895 vs NIR 2334 (NDWI max -0.074 over a 300 m box, fraction >= 0 is 0.000); MNDWI with SWIR-1.6 gives max 0.017 at Galchhi and -0.082 at Malekhu, and an off-channel hillslope control is indistinguishable at -0.044 index value | 2026-05-24 | — | Primary | High | narrative only | — | GOATAI measurement on Sentinel-2 L2A scene S2C_45RTL_20260524_0_L2A (AWS open data) ↗ |
| E-050 | Impact-crater pond storage volume (the '1.4 Mm3' figure) - English origin | 1.4 million m3 | 2026-08-30T11:23:00+08:00 | 2026-08-30 | Near-primary | Medium | narrative only | — | Xinhua (relaying China Ministry of Water Resources) ↗ |
| E-051 | Impact-crater pond storage volume, 31 Aug (SAR) | 0.65 million m3 (65万立方米) | 2026-08-31T05:14:00+08:00 | 2026-08-31 | Near-primary | Medium | narrative only | — | Dazhong Daily live blog (CCTV News relaying MWR) ↗ |
| E-052 | Implied mean depth of impact-crater pond (derived check of '0.11 km2 x 13 m' hypothesis) | 13 m | 2026-08-30T11:23:00+08:00 | — | Near-primary | High | narrative only | — | Arithmetic by this analysis from MWR figures ↗ |
| E-053 | Funnel-shaped water body beneath ice-avalanche source area (upper blockage >120,000 m2) | 120000 m2 (lower bound); depth unknown | 2026-08-28 | 2026-08-29 | Near-primary | Medium | narrative only | — | CCTV News 'News 1+1' (MNR Geological Hazard Technical Guidance Center, Chen Hongqi) ↗ |
| E-054 | UNOSAT 4260 barrier lake 1 (near Nepal-China border) area | approximately 12 (map inset label 11.92 ha; 990 m x 253 m) ha | 2026-08-28 | 2026-08-31 | Primary | High | narrative only | — | UNOSAT (UNITAR) ↗ |
| E-055 | UNOSAT 4260 barrier lake 2 (near source) area | approximately 19 (map inset label 19.51 ha; 625 m x 413 m) ha | 2026-08-28 | 2026-08-31 | Primary | High | narrative only | — | UNOSAT (UNITAR) ↗ |
| E-056 | Lower (Puripu Qiangzangbu / Chhochen-Purepu confluence) barrier lake volume, 27 Aug morning | 2 million m3 | 2026-08-27 | 2026-08-27 | Near-primary | Medium | narrative only | — | Global Times (citing MWR via CCTV) ↗ |
| E-057 | Lower barrier dam radar geometry and storage | 2.2 million m3; mean dam height 60 m; dam length ~1,100 m; mean width ~300 m; lake area ~0.1 km2 | — | 2026-09-05 | Near-primary | Medium | narrative only | — | Science and Technology Daily (Xinhua; Xizang command HQ, Ren Wei) ↗ |
| E-058 | Lower barrier lake 'basically drained' (30 Aug) | lower barrier lake basically drained (MWR) | 2026-08-30 | 2026-08-30 | Near-primary | High | narrative only | — | Xinhua (MWR) ↗ |
| E-059 | Lower barrier lake 'completely released' (1 Sep) | lower barrier lake completely released (Xizang command HQ) | 2026-09-01 | 2026-09-01 | Near-primary | High | narrative only | — | Xinhua via Dazhong Daily live blog (Xizang '8.26' command HQ) ↗ |
| E-060 | River rise from 28 Aug barrier-lake overflow | 0.6 m | 2026-08-28 | 2026-08-28 | Secondary | Low-Medium | narrative only | — | Al Jazeera (quoting Nepali Army spokesperson) ↗ |
| E-061 | NDRRMA-reported lake area behind Lhende Khola blockage (Nepali original) | 0.11 km2 | 2026-08-27T11:44:00+05:45 | 2026-08-27 | Secondary | Medium | narrative only | — | OnlineKhabar (Nepali), reporting NDRRMA statement ↗ |
| E-062 | Nepal FFD (Parajuli): upper lake area and volume, 4 Sep | 0.6 million m3 (६ लाख घनमिटर); area ~0.19 km2 | 2026-09-04 | 2026-09-04 | Secondary | Low-Medium | narrative only | — | OnlineKhabar (Nepali), quoting DHM Flood Forecasting Division chief Binod Parajuli relaying Chinese team ↗ |
| E-063 | New landslide-dammed lake 2.8 km downstream of Puripu lake (29 Aug), breached | 2.8 km downstream of Puripu Qiangzangbu barrier lake | 2026-08-29 | 2026-08-30 | Near-primary | Medium | narrative only | — | Tide News (MWR citing Ministry of Emergency Management) ↗ |
| E-064 | CLaSH: two post-event lakes (major axes) | 770 m (lower lake major axis); 530 m (upper lake major axis) | 2026-08-28 | 2026-09-02 | Near-primary | Medium | narrative only | — | Center for Land Surface Hazards (CLaSH), NSF-funded; ArcGIS StoryMap ↗ |
| E-065 | Chinese scientist: no barrier lake in the original (main) process | no barrier lake in the original process; the lake formed later behind a small adjacent landslide | 2026-08-28 | 2026-08-29 | Secondary | Medium | narrative only | — | Wen Wei Po quoting Xu Qiang (President, Chengdu University of Technology) ↗ |
| E-066 | No moraine lakes >0.1 km2 on Nepal side above Gyirong Port | 0 count (Nepal side); 13 on Chinese side | — | 2026-08-30 | Near-primary | Medium | narrative only | — | Tide News (MWR) ↗ |
| E-067 | Nepal FFD (Parajuli): lake water ~10% of main flood water (27 Aug) | 10 % of Wednesday's flood water | 2026-08-27 | 2026-08-27 | Secondary | Low | narrative only | — | OnlineKhabar English, quoting Binod Parajuli (DHM FFD) ↗ |
| E-068 | Lower barrier lake storage >2.5 Mm3 (CCTV, 28 Aug) | 2.5 million m3 (lower bound) | 2026-08-28 | 2026-08-28 | Secondary | Low-Medium | narrative only | — | Global Times (citing CCTV News) ↗ |
| E-069 | Lower barrier lake maximum storage (China Anneng expert) | 4 million m3 (max, 27 Aug); >2.5 million m3 (28 Aug afternoon) | 2026-08-27 | 2026-08-29 | Secondary | Low-Medium | narrative only | — | CCTV 'News 1+1' (China Anneng 3rd Bureau chief expert Zhou Zhidong) ↗ |
| E-070 | Seismic-inversion source volume (regional stations) | 284-492 Mm3 bulk source volume | 2026-08-26T08:37:10+05:45 | 2026-09-02 | Near-primary | Low-Medium | narrative only | — | CLaSH StoryMap (analysis/figure by Christopher Calvelage, EarthScope) ↗ |
| E-071 | Seismic-inversion source volume (teleseismic stations) | 197-349 Mm3 bulk source volume | 2026-08-26T08:37:10+05:45 | 2026-09-02 | Near-primary | Low-Medium | narrative only | — | CLaSH StoryMap (Christopher Calvelage, EarthScope) ↗ |
| E-072 | ICIMOD cryosphere specialist estimate of collapse size | 100-200 Mm3 collapse size (quantity type not stated) | 2026-08-26 | 2026-08-28 | Secondary | Low | narrative only | — | The Kathmandu Post quoting Dr Mohd. Farooq Azam (ICIMOD) ↗ |
| E-073 | Tribhuvan University (Dahal) conservative satellite-based estimate | 25 million m3 (up to 40; others up to 100) | 2026-08-26 | 2026-09-02 | Secondary | Low | narrative only | — | OnlineKhabar English quoting Prof Ranjan Kumar Dahal (TU) ↗ |
| E-074 | CU Boulder Today: 50 million metric tons of ice, rock and water (earliest instance found) | 50 million metric tons (equated to ~13 billion US gallons) | 2026-08-26 | 2026-09-03 | Tertiary | Low | narrative only | — | CU Boulder Today (university news Q&A with Alton Byers, INSTAAR) ↗ |
| E-075 | Britannica failure mass | 55 million short tons (about 50 million metric tons) of ice and rock | 2026-08-26 | — | Tertiary | Low | narrative only | — | Encyclopaedia Britannica (John P. Rafferty); read via Wayback 2026-09-09 ↗ |
| E-076 | Geopera model-calibrated flow volume | 100 million m3 (±40%) | 2026-08-26 | 2026-08-28 | Tertiary | Low | narrative only | — | Geopera blog (Darcy Weedman) ↗ |
| E-077 | UNOSAT detachment zone (Landsat-9, 26 Aug 2026) | 1.957 (GDB Area_m2 1,956,822.875; geodesic 1,957,373 m2) km2 | 2026-08-26 | 2026-08-31 | Near-primary | Medium | narrative only | — | UNOSAT (UNITAR) ↗ |
| E-078 | Relation of 2026 source to 2025 source (HiRISK NP3) | 2026: rock-ice detachment of glacier RGI2000-v7.0-G-15-05732 north of Lirung massif, Lhende catchment, 28.288708°N 85.528159°E, ~5200 m; mass flow met 2025 Purepu GLOF deposits on valley floor <3000 m and dammed Lhende Khola qualitative; decimal degrees; m | 2026-08-26 | 2026-08-28 | Near-primary | Medium | narrative only | — | HiRISK RHA Report No. NP3 (Q. Liu, A. Khatri, A. Lord, M. Ghouli, N. Thapa, J. Steiner, W.W. Immerzeel, S. Allen) ↗ |
| E-080 | USGS inundation-boundary mapping status | underway (stated); no downloadable boundary dataset linked from page as of last update 8/28/2026 | — | 2026-08-27 | Primary | High | narrative only | — | USGS Landslide Hazards Program ↗ |
| E-081 | UNOSAT Product 4260 identity | ID 4260; "Satellite-Detected Newly Formed Barrier Lakes Following an Ice-Rock Avalanche in Rasuwa District, Nepal, as of 28 August 2026"; GLIDE FL20260826NPL | 2026-08-28 | 2026-08-31 | Primary | High | narrative only | — | UNOSAT (UNITAR) ↗ |
| E-082 | UNOSAT GDB FloodExtent layer area (cumulative floodwater/mudflow/rockflow, 26-28 Aug) | 64.9 (geodesic; attribute Area_m2 65,660,992) km2 | 2026-08-26/2026-08-28 | — | Near-primary | Medium | narrative only | — | UNOSAT (UNITAR) ↗ |
| E-083 | Copernicus EMS Rapid Mapping activation EMSR927 | activated 2026-08-26T09:53; eventTime listed 2026-08-25T22:00; activator EC Services / DG ECHO; category Flood / Flash flood; Charter 1052; GDACS FL1104124 | 2026-08-26 | 2026-08-26 | Primary | Medium | narrative only | — | Copernicus EMS (European Commission) ↗ |
| E-084 | Sentinel Asia: JAXA ALOS-2 Flood Proxy Map | SAR flood-extent proxy from ALOS-2 acquisition 2026-08-28 (file stamp 202608280620); GeoJSON + shapefile; posted 2026-08-31 | 2026-08-28 | 2026-08-31 | Near-primary | Medium | narrative only | — | JAXA via Sentinel Asia ↗ |
| E-085 | Charter narrative: surge onset time at Bhote Koshi (Tibet side) | approximately 09:15 local time (NPT) on 26 Aug 2026 NPT | 2026-08-26T03:30Z | 2026-08-26 | Secondary | Low-Medium | narrative only | — | International Charter Space and Major Disasters ↗ |
| E-090 | 2025 trigger: official Nepal attribution (NDRRMA) | Rapid discharge/outburst of supraglacial lake on Purepu Glacier; at least part supraglacial drainage qualitative | — | 2025-07-10 | Primary | High | narrative only | — | Government of Nepal, NDRRMA Situation Report #1 ↗ |
| E-091 | 2025 trigger: peer-reviewed confirmation (field + remote sensing) | Supraglacial GLOF from Purepu Glacier lake on 8 July 2025; outflow initially over glacier surface then gorge qualitative | 2025-07-08 | — | Primary | High | narrative only | — | Zhang T.-G., Wang W.-C., Khadka N., ... Yao T.-D., Advances in Climate Change Research (Elsevier/KeAi), doi:10.1016/j.accre.2026.06.022 ↗ |
| E-092 | 2025 trigger caveat: incomplete drainage and possible englacial/subglacial contribution | 2025 drainage incomplete; englacial/subglacial contributions 'cannot be excluded' qualitative | — | 2026-08-12 | Near-primary | Medium | narrative only | — | Xu Q., Kang S., Du W., et al., EGUsphere preprint egusphere-2026-4065 (Brief communication; not yet peer reviewed) ↗ |
| E-093 | 2025 Lende/Bhote Koshi flood: first reported impact time at Rasuwagadhi border post | 2025-07-08 03:15 NPT (05:30 China Standard Time) local time | 2025-07-08T03:15:00+05:45 | 2025-07-09 | Near-primary | High | narrative only | — | HiRISK (Qiao Liu, Amrit Thapa, Jakob Steiner), Rapid Hazard Assessment Report No. CN1 ↗ |
| E-094 | 2025 source lake coordinates and elevation (HiRISK) | 28.402561°N, 85.646705°E; 5160 m a.s.l. decimal degrees; m a.s.l. | — | 2025-07-09 | Near-primary | High | narrative only | — | HiRISK RHA CN1 ↗ |
| E-095 | 2025 damage summary (NDRRMA, as of 10 July 2025) | Friendship (Miteri) Bridge destroyed; Rasuwagadhi dry port damaged; 3 hydropower plants; 16 km road counts; km | 2025-07-08 | 2025-07-10 | Primary | High | narrative only | — | Government of Nepal, NDRRMA Situation Report #1 ↗ |
| E-096 | 2025 published gauge hydrographs at Galchhi, Malekhu, Betrawati, Syabrubesi | NOT FOUND availability | 2025-07-08 | — | Primary | Qualitative | narrative only | — | Department of Hydrology and Meteorology (DHM), river-watch portal ↗ |
| E-097 | 2025 availability: DHM Flood Report 2082 annex - 8 Jul 2025 preliminary report (issued 2082/03/24 10:00) | Timure hydropower gauge +~3.5 m at 03:10; Syaphrubesi 3.65 m @03:30 -> 5.37 m @03:40 then transmission stopped; Betrawati 1.60 m (~220 m3/s) @05:00 -> 3.63 m @05:10, max 4.18 m (~1600 m3/s) @05:50 NPT | 2025-07-08T03:10:00+05:45 | 2026-05-08 | Primary | Medium | narrative only | — | DHM Flood Forecasting Division ↗ |
| E-098 | ICIMOD statement linking 2026 event site to 2025 flood | 'The same site devastated by last year's Rasuwa flood' qualitative | 2026-08-26 | 2026-08-26 | Primary | Qualitative | narrative only | — | ICIMOD media advisory, 26 Aug 2026 (quote: Qianggong Zhang) ↗ |
| E-099 | KP 28 Aug: DHM & ICIMOD supraglacial-lake GLOF attribution refers to JULY 2025 event | the supraglacial-lake GLOF attribution in this article refers to July 2025 | — | 2026-08-28 | Secondary | High | narrative only | — | The Kathmandu Post (Subeksha Poudel) ↗ |
| E-100 | USGS statement on 2015 Gorkha-earthquake debris avalanche from same mountain | several million cubic metres of ice and debris; start ~5,000 m elevation; fell ~1,900 m | 2015-04-25 | 2026-08-27 | Primary | Medium | narrative only | — | USGS Landslide Hazards Program ↗ |
| E-101 | 2015 Langtang avalanche: DEM-derived deposit volume (Fujita et al. 2017) | 6.81 ± 1.54 × 10^6 m³ (primary event); 0.84 ± 0.92 × 10^6 m³ (succeeding rockfalls) m³ | 2015-04-25 | 2017-05-22 | Primary | High | narrative only | — | Fujita K. et al., Natural Hazards and Earth System Sciences 17:749-764 ↗ |
| E-110 | Costa & Schuster (1988) landslide-dam peak discharge regression | Q = 0.0158 (PE)^0.41 Q in m³/s; PE in joules | — | 1988-07 | Primary | High | narrative only | — | Costa J.E. & Schuster R.L., GSA Bulletin 100(7):1054-1068 (Table 6) ↗ |
| E-111 | Costa & Schuster (1988) definition of potential energy PE | PE = dam height (m) × lake volume (m³) × specific weight of water (9,800 N/m³) J | — | 1988-07 | Primary | High | narrative only | — | Costa & Schuster 1988, GSA Bulletin, p.1065 ↗ |
| E-112 | Costa & Schuster (1988) stated applicability / limits | Large scatter (SE 64-185%); regressions suggested for reconstructing past peaks; envelope for conservative rapid prediction; sediment bulking can increase peaks manyfold downstream qualitative | — | 1988-07 | Primary | High | narrative only | — | Costa & Schuster 1988, GSA Bulletin, pp.1065-1067 ↗ |
| E-120 | Rainfall role | not a regular rainfall flood; no heavy rainfall reported immediately before the event | 2026-08-26 | 2026-08-26 | Secondary | Medium | narrative only | — | Kathmandu Post (reporting DHM) ↗ |
| E-121 | Infrastructure exposure | buildings, bridges, highway and hydropower assets damaged | 2026-08-26 | 2026-08-26 | Near-primary | Qualitative | narrative only | — | ICIMOD; USGS ↗ |
Changelog
Revisions to this reconstruction
Dated, so a reader can see what the page said before and why it changed. Fix identifiers refer to the 11 September review.
- No model change: no re-run, no parameter change, no new external facts. Simulation references remain sim-claude edff56c.
- New finding — the corridor detected the wave in the loss of its telemetry, not in the signal: three stations stopped in strict downstream order, the second 25 minutes before the first warning and the third 5 minutes after it. Published with its limits (upper-bound loss times at 10-minute resolution, causes other than destruction, model chainage) and explicitly as a design finding recovered afterwards, not a method available on the day. E-039.
- New finding — the 38-minute gap between the seismic origin and the first warning was not a sensing gap: the signal existed at T+0 and the warning travelled by telephone. Stated with the automatic-solution latency and the initial earthquake misclassification in the same block, so it cannot be read as a claim that a warning was possible in minutes. E-045.
- New section “Why this event was hard to measure”: six structural reasons, then a three-phase frame — before (susceptibility, not prediction), during (not Earth observation), after (where measurement is actually possible).
- Lead time reframed as a property of location rather than technology, with an explicit instruction not to generalise the observed figures to locations without an observed arrival.
- Registered a census of Sentinel-2 availability over the corridor (E-046): no scene below 40% cloud in the 2026 post-event window, against 1% cloud in the 2025 analogue — which is why the 2025 event is measurable now and the 2026 corridor state is not.
- No model change: no re-run, no parameter change, no new external evidence. Simulation references remain sim-claude edff56c.
- New section “How much warning existed”: a lead-time ledger from T0 (08:37:10 NPT, E-002) with the offset and evidence for every corridor point, and the lead time between the first warning and each local rise onset.
- Three register entries added and used for those numbers — E-036 (observed Devghat rise onset), E-037 (detection-chain intervals) and E-038 (warning-to-onset lead time) — each naming its parent entries. Register count 92 → 95; external evidence still as of 11 September.
- New sections: “What the corridor could not see”, “What was in the path” (asset classes, with not-assessed stated where the register cannot support a quantity, plus one labelled worked illustration), and a closing “What a fleet operator can establish now”.
- Cascade Class now opens with why the unresolved mechanism does not block operational use: the downstream response is the same under all three branches.
- “The finding worth arguing about” gains the operational consequence of the routing miss — a systematic overstatement of available travel time for any system built on the same ingredients.
- Section order changed so the stakes precede the epistemology. Nothing epistemic was removed or softened: the 1.4 Mm³ withdrawal, the stage-baseline defect, the “uncalibrated” definition and the missing-data register are unchanged.
- Cascade-class heading is now “Same cascade class as Sikkim, different initiating process”, and the three hydraulic pathways are named in the opening sentence.
- The GLOF comparison reads “Both are cryosphere-driven cascades, but only South Lhonak is established as a classical GLOF pathway.”
- Evidence-register roles split further: timing reference (the T0 anchor), timing diagnostic (observed arrivals), stage observational check (measured stage), corroboration (an independent report of the same quantity). The register records how each former value maps.
- Branch wording no longer ranks hypotheses: branch A is “currently more consistent with the available timing and event-classification evidence, while the hydraulic pathway remains unresolved”, and branch C is “less consistent … after the refresh”.
- Page title and heading changed from “Glacier-Collapse Flood” to “Ice-Rock Slope-Failure Cascade”, matching the classification and the USGS reclassification documented on this page. The social card and the evidence register’s case field follow.
- “Validation” retired from the evidence register: observations now carry use = observational check (stage) or timing diagnostic (arrival timing and the T0 anchor). Validation is reserved for a frozen model architecture evaluated against independent or withheld data, and the register records how the former values map.
- “Tier 2 and 3 sources … never for validation” reworded: observational checks rely on primary or appropriate near-primary evidence.
- Cascade-class opening sentence disambiguated — the initiating process is Rasuwa’s, not something shared with South Lhonak.
- Classification wording finalised as “rapid ice-rock slope failure, debris avalanche and flash flood — hydraulic mechanism provisional”.
- The A/B/C mechanism taxonomy is now used from the ensemble introduction onward: two modelled end-member branches within a three-branch hypothesis space.
- The header summary drops “assumed failure volume” in favour of the branch names and “assumed hydraulically mobilised volume”.
- “Cascade class” used consistently in place of “hazard class”.
- The hydraulic consistency table now separates clear-water discharge, debris-bulked volume flux and water-equivalent discharge, with ranges at two significant figures instead of collapsing to a single figure.
- “Validation” reserved for a later stage; this stage is evidence consistency, observational checks and independent diagnostics. The #validation anchor is kept so existing links keep working.
- The transfer-validation sequence is stated in order: constrain routing on July 2025, freeze it, then add the transient-obstruction mechanism and re-evaluate 2026 without further adjustment.
- Classification changed to “rapid glacierised slope failure, debris avalanche and flash flood — hydraulic mechanism provisional”. The former wording put a contested mechanism (landslide dam) in the event name.
- “The routing is falsified” replaced throughout: the observed timing rejects the shared routing configuration as presently parameterised, and the candidate contributors are listed rather than implying the cause is isolated.
- The direct member’s 5.0 Mm³ is renamed an assumed hydraulically mobilised volume — a scenario label that does not enter the solver and is not an estimate of the total failed mass.
- The four members are stated to be end-member screening experiments; a minutes-scale transient obstruction is named as the missing mechanism and carried as branch B, not modelled.
- The archetype section is restructured into one initiating process with three possible hydraulic pathways (A continuous propagation, B transient plug, C sustained blockage).
- The Manning inversion is bounded as an order-of-magnitude consistency check, with values rounded to one significant figure.
- The independence of the timing test is elevated: the ensemble predates the recovered timestamps, so the observations are a diagnostic rather than a test built to pass.
- Score framing replaced with an evidence-consistency matrix per member; individual pass/fail results retained.
- New sections: the epistemic state (high / moderate / unresolved), and what the model does and does not resolve — including the debris-bulking treatment, a definition of “uncalibrated”, and the three distinct volume quantities.
- Added an illustrative hero reconstruction of the source-area cascade. An illustration rather than data, so it carries no evidence-register entry. The social-card image remains the ensemble hydrograph graphic from the simulation output.
- Case study published with a three-member ensemble; fourth member (direct) and per-member validation added the same day.
- Member count reconciled to four in the hero, simulation panel and results table; volumes labelled by type (F-01, F-02, F-21).
- Header chips restated as hypotheses; archetype rewritten as two branches (F-03, F-04).
- “~1.4 Mm³ reported impoundment” re-identified as a 30 August post-event crater pond; the headline argument built on it withdrawn and replaced (F-05, F-19).
- Blockage-location conflict published (F-06). “+30 min” tile corrected to a rise duration (F-07).
- Timing checks made evaluable from DHM telemetry; rapid onset moved to internal consistency; scores re-computed per member (F-08, F-13).
- Costa & Schuster (1988) relation verified and compared against water-only breach peaks (F-09).
- USGS origin times registered; conflicting timing accounts recorded without reconciliation (F-10).
- Low-member Malekhu wording tied to the model’s actual arrival rule (F-11).
- Stage-baseline defect disclosed with a diagnostic re-score; correction and re-run left for approval.
- Post-event barrier lakes, July 2025 event, inundation products and source-volume estimates added (F-14–F-17). KP 28 Aug passage resolved as referring to 2025 (F-18).
- Page-specific social metadata; evidence register, changelog and this section published (F-12, F-20, F-22).
Collaboration
Data that would sharpen this reconstruction
If you hold any of these, get in touch — they would change what this page can say.