Multi-HazardReal-TimeExplainable AIPhysics-CertifiedZero Moraine HardwareGIS NativeSovereign DeployableMission Mausam Aligned
Architecture · Conceptual Stage▾

ATOM-GLOF is a designed architecture under active development. Performance figures are design targets or literature benchmarks, each attributed below. No production deployment is in place.

goatai.io/glof

Glacial Hazard Intelligence

Neuro-Physics Multi-Hazard Cascade Intelligence Platform. Early Warning. Causal Understanding. Real-Time Action.

Lakes In Target Inventory

195

ICIMOD inventory scope

Inundation Map Generation (design target)

<60s

Design target

Target Speed-Up vs Classical

100×

Internal benchmark, vs HEC-RAS 2D

Warning Lead Time (design objective)

Earliest signal

Days where precursors exist; minutes where failure is abrupt

Live Physics Simulation

South Lhonak GLOF — 4 October 2023

Interactive cascade simulation of one of the most damaging Himalayan GLOFs on record. Physics-coupled discharge routing across 8 stations, Manning's inundation modeling, and a real-time hydrograph — the class of event ATOM-GLOF is built to predict before it happens. Every discharge shown is modelled output, not measured discharge, and is uncalibrated against gauge data.

Peak Discharge

modelled

65,268 m³/s

Chungthang · T+3.48 h

Cascade Distance

modelled

130 km

South Lhonak → Rangpo

Time to Rangpo

modelled

5.08 hrs

Modelled peak time, from model start

Infrastructure Loss

reported

₹4,500+ crore

5 NHPC projects impacted

Modelled values are VARUNA outputs, uncalibrated against gauge data. Reported is a figure reported about the event itself, not a model result; its source citation is pending. Times are the modelled peak time counted from model start (T+0) — in the model, overtopping and breach begin at T+0.17 h.

S. LhonakT+0h→ChungthangT+3.48h→SingtamT+3.79h→RangpoT+5.08hmodelled peak times from model startSikkim, India
VARUNA · Live Cascade · Sikkim 2023
Full Screen ↗

Physics-coupled Manning routing. At T+3.48 h the modelled Chungthang dam failure takes the routed GLOF peak arriving at the dam site, 13,803 m³/s, to a combined 65,268 m³/s — 4.7× that arriving peak, and 3.7× the 17,615 m³/s breach peak upstream. ATOM-GLOF is designed to detect moraine deformation days before water level rise on a pathway that offers precursors — a design premise, not a demonstrated result, and not a lead time for an abrupt failure.

Open Simulation →

How these numbers compare (published literature)

Published reconstructions of the same event. These are not results produced by VARUNA. The quantities differ between studies — a moraine-breach peak, an overtopping discharge and a post-dam-break peak are different things — so the rows are not directly comparable with one another either. Each row names the paper that published the figure; the values were checked against those papers.

VARUNA reconstruction (modelled)

Produced in our own model run. Uncalibrated against gauge data and not independently reviewed. Times are modelled peak times from model start.

Breach peak17,615 m³/s

T+1.59 h · modelled breach outflow

Chungthang, post-dam-break65,268 m³/s

T+3.48 h · routed GLOF peak plus modelled dam-break release

Rangpo40,041 m³/s

T+5.08 h · routed peak of the combined wave

Where they disagree. The breach peak, 17,615 m³/s, is above every published breach figure listed — about 40% above the moraine-breach peaks and about 11% above the overtopping discharge — though definitions differ across papers. Chungthang is further out: 65,268 m³/s is roughly 4.4× the highest published post-dam-break peak and about 9× the HEC-RAS reconstruction. Rangpo at 40,041 m³/s carries that difference down the corridor — the one observed streamflow figure we hold for the corridor, further downstream at Gazoldoba, is ~8,252 m³/s. The discrepancy is unresolved and under review with the model owner; it is stated here rather than reconciled, and no model output has been adjusted to close it.

Case Studies

Two Himalayan cascades, one hazard class

VARUNA reconstructions of real events — one reconstructed and interactive, one in progress and explicitly preliminary. Neither is calibrated against gauge data. Both are published with their uncertainty attached.

Warning architecture

Cryosphere Cascade Early Warning System

The warning architecture these reconstructions motivate: source detection, corridor tracking, multi-sensor fusion and physics-grounded forecasting, designed so the system keeps reasoning when corridor instruments are lost.

Open the EWS architecture →
01Reconstructed · live simulation

Sikkim 2023 — South Lhonak GLOF

Moraine-lake outburst on 4 October 2023. Physics-coupled routing across 8 stations, a modelled post-dam-break peak of 65,268 m³/s at Chungthang, Rangpo reached at T+5.08 h. Modelled output, uncalibrated against gauge data — published reconstructions of the same event give lower peaks.

130 km cascadeModelled peak 65,268 m³/s8 routing stations
Open the cascade simulation →
02Preliminary · evidence updated 21 Sep

Nepal 2026 — Langtang Lirung Ice–Rock Avalanche

A ~103 Mm³ rock–ice slope failure on 26 August 2026, about 12% ice, became a debris flow and then a flash flood down the Bhote Koshi–Trishuli corridor, with ~20 Mm³ of excess water estimated at Devghat. The open question is how rock, ice and water were transformed between the two. The earlier four-member screening ensemble stays published as provenance.

~103 Mm³ rock + ice~20 Mm³ excess waterMultiphase cascade
Read the case study →

The Himalayan Hazard

The hazard is the interaction, not the lake alone

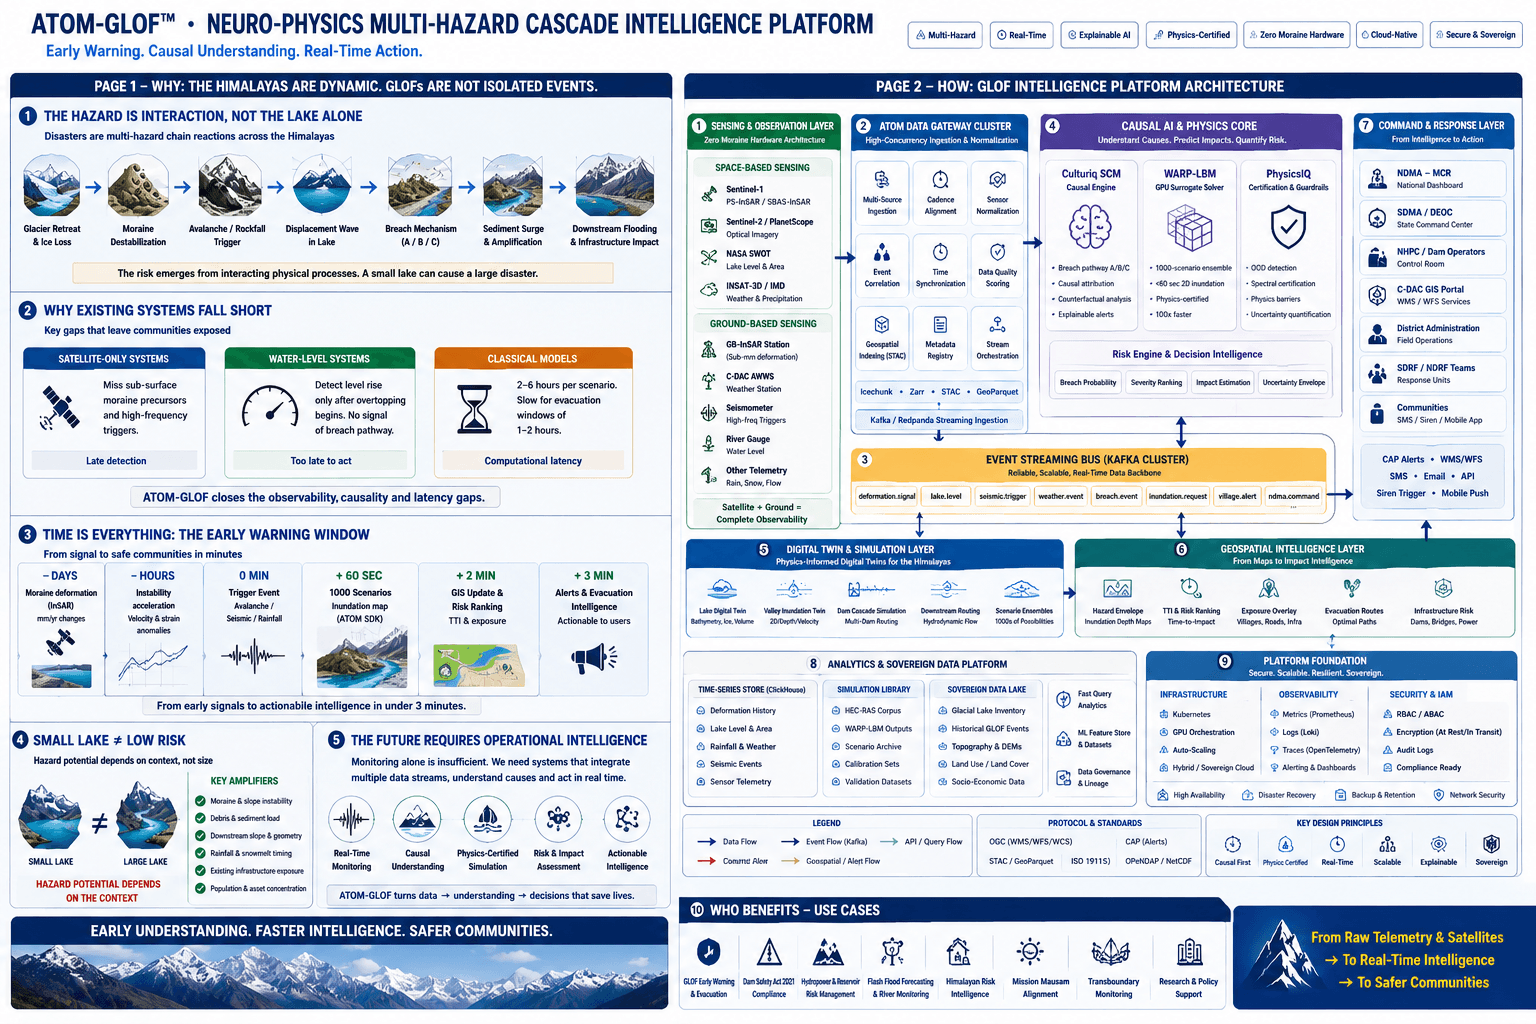
Disasters are multi-hazard chain reactions. A small lake in a destabilized moraine can be more dangerous than a larger lake in stable terrain. The risk emerges from interacting physical processes across space and time.

01

Glacier Retreat & Ice Loss

Thermal forcing accelerates ice mass loss

02

Moraine Instability

Dam weakening from melt-water saturation

03

Avalanche / Rockfall

Slope failures from destabilized terrain

04

Displacement Wave

Mass entering lake generates surge

05

Breach Mechanism (A/B/C)

Overtopping, piping, or structural failure

06

Sediment Surge

Amplified debris load in flood wave

07

Flood Wave

High-velocity downstream inundation

08

Downstream Impacts

Communities, dams, infrastructure

Small Lake ≠ Low Risk

Hazard potential depends on context: moraine instability + slope geometry + infrastructure exposure = true risk level. The hazard is the interaction.

Critical Gaps

Why existing approaches fall short

Three dominant approaches, three critical gaps. ATOM-GLOF is designed to close the observability, causality and latency gaps simultaneously.

Satellite-Only Systems

  • Miss sub-surface moraine instability
  • Detect water level rise only after overtopping begins
  • Late detection → limited decision window

Water-Level Systems

  • No visibility of moraine deformation or displacement
  • 2–6 hour evacuation response window
  • Too late to act on early signals

Classical Numerical Models

  • 2–6 hours per simulation scenario
  • Computational latency delays decisions by hours
  • Early warning window lost before simulation completes

ATOM-GLOF is designed to close the observability, causality & latency gaps simultaneously.

The Early Warning Window

Warning begins at the earliest observable change

Conventional systems begin at water-level rise, which for some pathways is already late. The objective here is to start from the earliest observable physical state change and maximise the useful warning time a corridor allows — days where precursors exist, as on a deforming moraine; minutes where the failure is abrupt, as in a brittle ice-rock detachment. The sequence below is the precursor-bearing case, not a lead time promised for every event.

Days

Moraine deformation

Accelerating instability — GB-InSAR + PS-InSAR

Hours

Velocity / strain changes

Earthquake · intense rainfall · threshold approach

Minutes

Trigger event

Water level rise · displacement surge detected

0 min

1000 scenarios run

GIS inundation map generated by WARP-LBM

+60 sec

Confidence scoring

Risk ranking · time-to-impact per village

+2 min

Automatic SMS alerts

State agencies and district administrations notified

+3 min

Operational intelligence

Actionable to emergency operations centers

Early Understanding. Faster Intelligence. Safer Communities.

From raw telemetry and satellite data → to real-time intelligence → to life-saving action.

Nine-Layer Agentic Architecture

From raw telemetry to real-time operational decisions

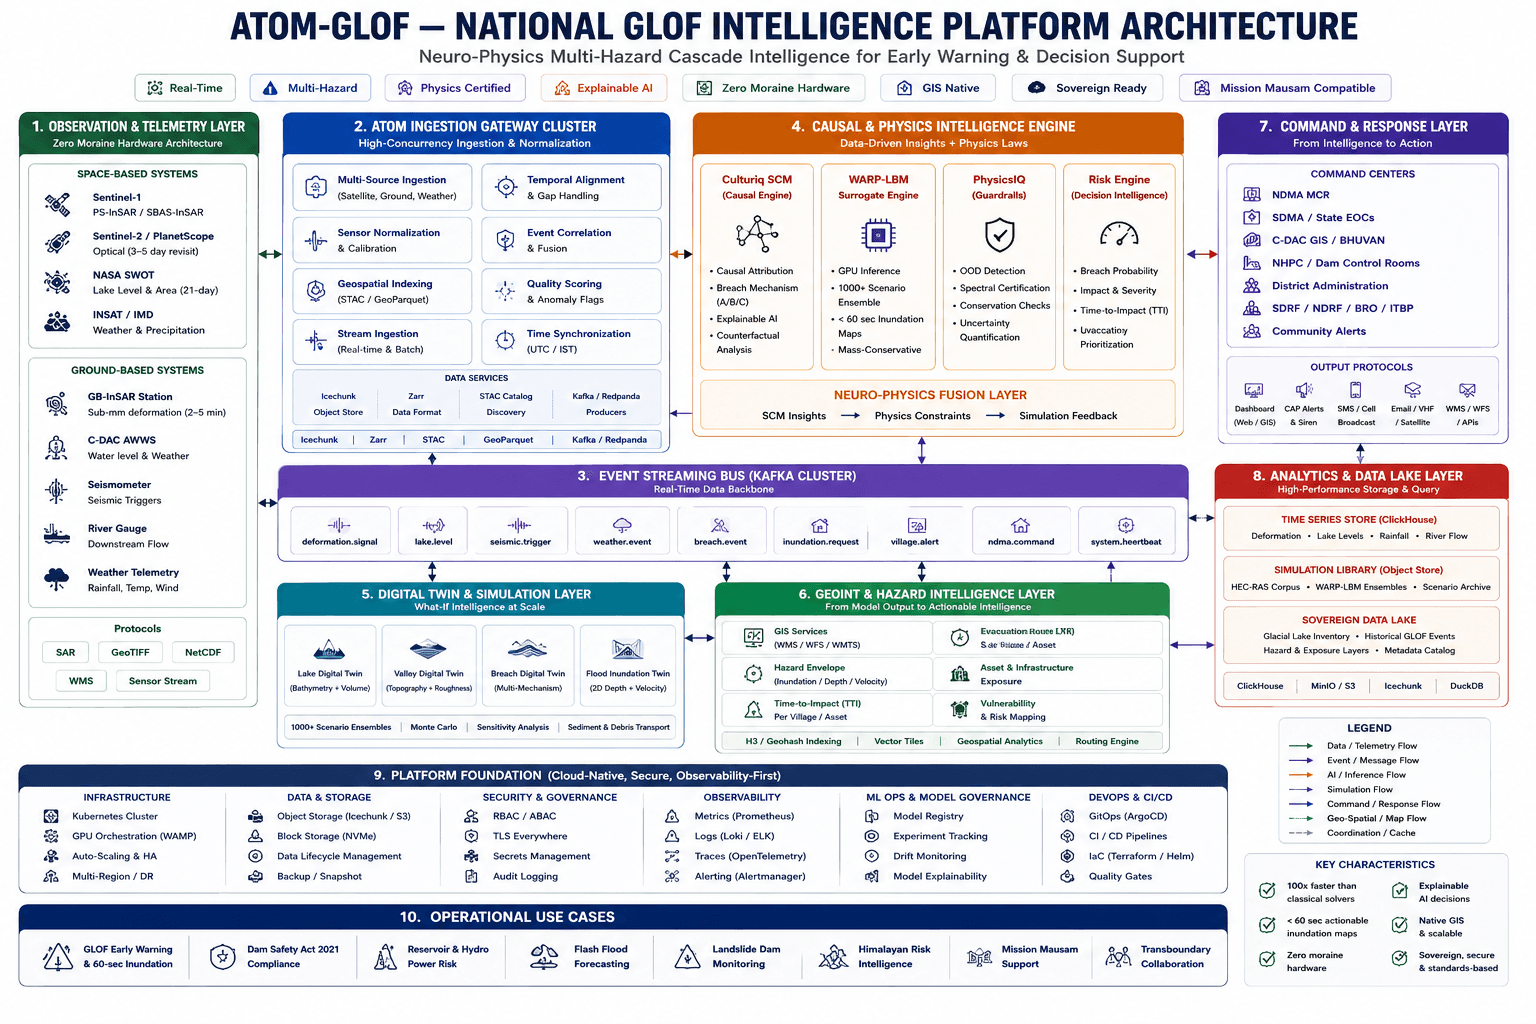
Four agentic agents orchestrate across nine architectural layers — from satellite observation to evacuation coordination. The same SENSE → UNDERSTAND → DECIDE → ACT cycle as every GoatAI platform, grounded in glacial physics.

ATOM-GLOF · National GLOF Intelligence Platform · Nine-Layer Architecture

ATOM-GLOF Nine-Layer Agentic Architecture — from observation to command response

01 — Monitoring Agent

Sense

Layers 1–3: Observation · Ingestion · Event Streaming

  • Sentinel-1/2 SAR · PS-InSAR · SBAS-InSAR — space-based deformation
  • NASA SWOT — lake level & area (21-day revisit, R²=0.99)
  • GB-InSAR — ground-based, sub-mm accuracy, 2–5 min refresh
  • Seismometer · River gauge · Weather telemetry · C-DAC AWWS
  • Kafka event bus — all signals fused and temporally aligned in real-time

02 — Prediction Agent

Predict

Layers 4–6: Causal Engine · Digital Twin · GeoINT

  • ATOM SCM — causal breach mechanism attribution (A/B/C pathways)
  • WARP-LBM — GPU surrogate, 1000+ scenarios, <60s inundation maps
  • PhysicsIQ — out-of-distribution detection, conservation checks
  • Digital twin — lake, valley, breach mechanism, flood inundation
  • GeoINT layer — TTI per village, hazard exposure, vulnerability mapping

03 — Reasoning Agent

Reason

Embedded in Layers 4–6

  • Which system is in high-sensitivity regime? (moraine, valley saturation)
  • What threshold breaks the cascade? What terrain absorbs shock?
  • How do small changes amplify non-linearly?
  • Confidence envelope + causal attribution per breach pathway
  • Explainable AI — why this pathway, not just what outcome

04 — Decision Agent

Decide

Layers 7–9: Command · Data Lake · Platform Foundation

  • State-based adaptation — not threshold alerts ('system in high-sensitivity')
  • Per-village time-to-impact accounting for cascade amplification
  • Real-time route optimization as secondary failures occur
  • NDMA / SDMA / District Admin — tiered alert dispatch
  • Kubernetes + GPU orchestration, Prometheus observability, SOC 2-aligned controls (no audit performed)

WARP-LBM Surrogate

100–270× faster than HEC-RAS 2D

GPU-accelerated shallow water equations, mass-conservative and stable, with 1000+ scenario ensembles inside 60 seconds as the design target. Speed-up is an internal benchmark — indicative, benchmark documentation in preparation.

ATOM SCM

Causal Discovery Engine

Breach mechanism attribution across A/B/C pathways. Explainable AI — causal reasoning, not correlation. Tells you why this pathway, not just what will happen.

PhysicsIQ

Physics Certification Layer

Out-of-distribution detection. Spectral certification. Conservation checks for mass, momentum and energy, passed on the benchmark cases tested so far. The architecture is designed so that no output reaches dispatch without passing them.

Layer 7 — Command & Response

Designed for government-scale deployment

Six output channels specified. Seven target command-center environments. Standard GIS formats are chosen so that integration needs no custom connectors — the protocols are designed against existing national infrastructure.

Output Protocols (specified)

Dashboard (Web/GIS)

Real-time operational view for command centers and district administrations

CAP Alerts (Siren/Broadcast)

Common Alerting Protocol — national emergency broadcast infrastructure

SMS / Email

Immediate notification to state agencies, districts, and communities

Kafka / Rejnala (Streaming)

Real-time data feeds for downstream system integration

WMS / WFS / WMTS (Geospatial)

Standard GIS format — plug into BHUVAN, C-DAC GIS, ArcGIS, QGIS

Mobile Apps (iOS/Android)

Community-level alerts with per-village time-to-impact

Designed For Integration With

NDMA MCR — Multiscale Control Room (national)

SDMA / State Emergency Operations Centers

C-DAC GIS / BHUVAN (national GIS platform)

NHPC / Dam Control Rooms (reservoir safety)

District Administration (evacuation decisions)

SDRF / NDRF / ITBP (field response forces)

Community alerts — CAP, SMS, mobile push

These are the target integration environments the Layer 7 output protocols are designed against. No production integration is in place.

Deploy Glacial Hazard Intelligence

Three integration pathways

Each stakeholder group has a distinct operational need and integration model. Choose your pathway.

Government Agencies

NDMA, SDMA, State Administrations

Early warning needed for evacuation planning and coordination decisions.

  • Standard GIS format (WMS/WFS/WMTS)
  • Real-time alert API (Kafka topics)
  • Per-region time-to-impact estimates
  • 1000+ scenario ensemble outputs
Request Integration Assessment →

Dam Operators

NHPC, NTPC, Hydropower Companies

GLOF risk to upstream dams and reservoirs requires continuous upstream monitoring.

  • Private lake monitoring — designed capability
  • SCADA integration (specified)
  • Automated reservoir level management
  • Early risk alerts for operations
Request Operational Pilot →

Research & Policy

Universities, Institutes, Policy Bodies

Need validated physics-grounded frameworks for glacial hazard research.

  • 195-lake target inventory (ICIMOD-derived)
  • PhysicsIQ certification methodology
  • Collaborative research partnerships
  • Publication & knowledge advancement
Explore Research Partnership →

Design Intent

What makes ATOM-GLOF different

Designed for operational scale — 195 high-risk Himalayan glacial lakes across the ICIMOD inventory, government-scale deployment, and physics certification at every layer.

100× faster

Internal benchmark against HEC-RAS 2D — 100–270× at equivalent accuracy. Indicative; benchmark documentation in preparation.

<60 seconds

Design target: full 2D inundation map from trigger event across a 1000+ scenario ensemble

Zero moraine hardware

Architectural property — satellite and base camp only, no sensors in or on the moraine dam

Explainable AI

Physics-certified causal attribution — why this pathway, not black-box probability

GIS Native

Standard WMS/WFS/WMTS — designed to plug into BHUVAN, ArcGIS and QGIS without custom connectors

Sovereign Deployable

Indian tech stack · Mission Mausam aligned · Dam Safety Act 2021 aligned

Evidence Base (published literature)

The following are published results establishing that the sensing channels this architecture depends on carry usable signal. They are not results produced by ATOM-GLOF.

SBAS-InSAR detected a deformation precursor 120 days before the 2020 Jinwuco GLOF
PS-InSAR validation of Imja Lake ice dynamics (University of Washington, 2024)
SWOT satellite lake-level accuracy across 2,924 Himalayan lakes, R² = 0.99 (Han et al., 2026)

Internal Benchmarks

Produced in our own testing. Not independently reviewed.

WARP-LBM: 100–270× faster than HEC-RAS 2D at equivalent accuracy — indicative, benchmark documentation in preparation
PhysicsIQ: mass, momentum and energy conservation checks passed on the benchmark cases tested to date

Real-world reference

2023 Sikkim GLOF, ₹4,500+ crore in damages. Published InSAR analyses of South Lhonak show measurable pre-event lateral moraine deformation. A monitoring layer operating on that channel would have had signal days before water level rise — this is the design premise ATOM-GLOF is built on, not a demonstrated result. It is also pathway-specific: a deforming moraine offers precursors, while an abrupt ice-rock detachment does not, and no architecture recovers warning time the geometry does not allow.

Intended Use Cases

10 real-world scenarios

Who the architecture is designed to serve — from national disaster management to village-level preparedness.

01

GLOF Early Warning & 60s Inundation

Continuous monitoring, trigger detection and sub-minute inundation maps for evacuation decisions — the primary design case.

02

Dam Safety Act 2021 Compliance

Physics-grounded risk assessments aligned with India's Dam Safety Act 2021 monitoring obligations.

03

Reservoir & Hydropower Risk Management

Upstream lake monitoring designed to link with SCADA for automated reservoir level response.

04

Flash Flood Forecasting

Multi-hazard cascade modeling extending beyond GLOF to debris flows and secondary floods.

05

Landslide Dam Monitoring

Secondary failure detection — identifies temporary dams formed by landslides mid-event.

06

Himalayan Risk Intelligence

Continuous monitoring across the 195-lake target inventory, designed to provide national-scale hazard situational awareness.

07

Mission Mausam Alignment

Aligned with India's national weather and disaster preparedness modernization program.

08

Transboundary Coordination

Cross-border GLOF response on two axes: Nepal–China (TAR), where 25 of the 47 potentially dangerous lakes in the Koshi, Gandaki and Karnali basins sit inside the Tibet Autonomous Region (ICIMOD & UNDP, 2020), and the India–Nepal–Bhutan shared basins.

09

Research & Policy Support

Datasets published with their provenance and calibration status attached, PhysicsIQ certification methodology, collaborative research frameworks.

10

Community Resilience & Preparedness

Per-village time-to-impact estimates enabling hyperlocal preparedness and evacuation planning.

The Mission

From raw telemetry to safer communities

Traditional GLOF systems treat disasters as isolated events.

ATOM-GLOF is built to understand them as multi-hazard chain reactions.

Traditional systems start at water-level rise.

ATOM-GLOF is designed to start at the earliest observable change — days where precursors exist, minutes where failure is abrupt.

Traditional systems are reactive.

ATOM-GLOF is designed for proactive resilience.

Building a resilient, prepared, intelligent Himalayas.

ATOM-GLOF — Neuro-Physics Multi-Hazard Cascade Intelligence Platform

Ready to integrate glacial hazard intelligence?

Technical deep-dive · Operational assessment · Research collaboration

Changelog

Updated 14 September 2026 — Discharge figures here and in the linked Lhonak simulation now state what quantity they are and that they are modelled, uncalibrated output rather than measured discharge. Times are restated as modelled peak times from model start; they were previously described as counted from initial breach, which the model places 0.17 h later. The Sikkim 2023 reconstruction is no longer described as validated. The Chungthang amplification now names both discharges: 4.7× the routed GLOF peak arriving at the dam site (13,803 → 65,268 m³/s), or 3.7× the 17,615 m³/s breach peak; the page previously said 4× without saying which pair. A comparison against published reconstructions has been added, stating where our figures are higher. In the simulation, per-station discharge animations are labelled as illustrative curves scaled to the modelled peaks. Modelled values and reported facts are now visually distinguished. No model parameter or output was changed.

Updated 4 September 2026 — Performance and integration claims restated as design targets and attributed to their sources. ATOM-GLOF is a conceptual architecture under development; this page previously described several design objectives in operational terms.